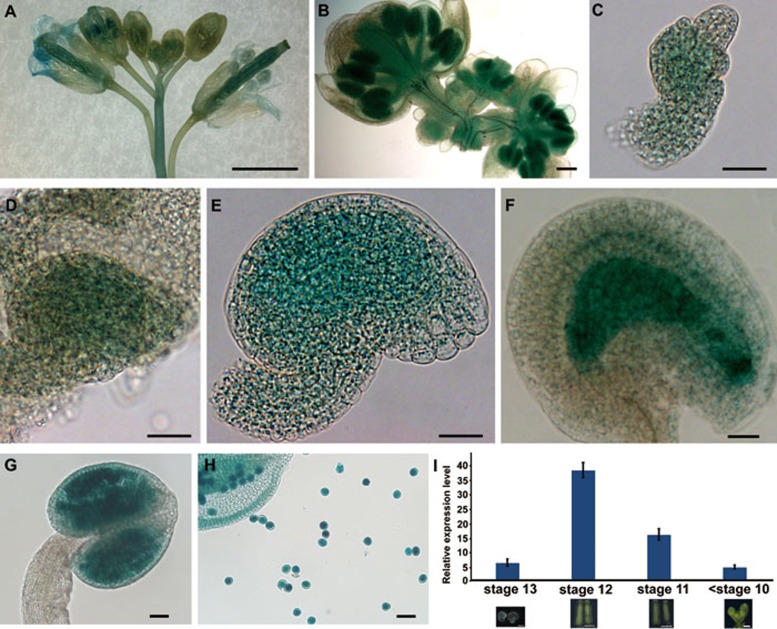
Figure 2.
The expression pattern of TPL. (A, B) GUS staining of inflorescences. (C-E) TPL was expressed in young ovules. (F) TPL was expressed strongly in the nucellus of a mature ovule. (G, H) TPL was highly expressed in an anther and pollens. (I) The overlapping expression of TPL and SPL revealed by qRT-PCR. The relative expression levels of TPL in the mature ovules from flower stage 13, the pistils from flower stage 12 or flower stage 11, and the flower buds before stage 10. The expression level of SPL was set to 1.0 in the different corresponding tissues. The error bars represent the SD of three biological replicates. Scale bars, 1 mm (A), 100 μm (B), 20 μm (C-F), and 50 μm (G, H).

