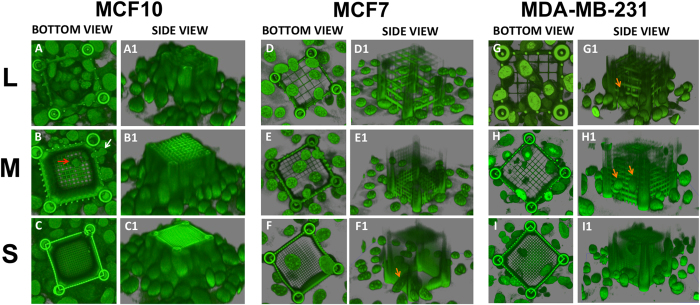
Figure 2. 3D Confocal reconstructions of representative cage-cell interactions for each pore size.
Panels (A–C) were obtained for MCF10A cell line, Panels (D–F) for MCF7 and Panels (G–I) for MDA-MB-231. All images were obtained after DAPI staining on fixed culture in PBS. All images are in false colour and microsctructures have a broad emission spectrum. Their luminescence can be collected together with the one of DAPI stained cell nuclei, in the range [420 nm, 500 nm].

