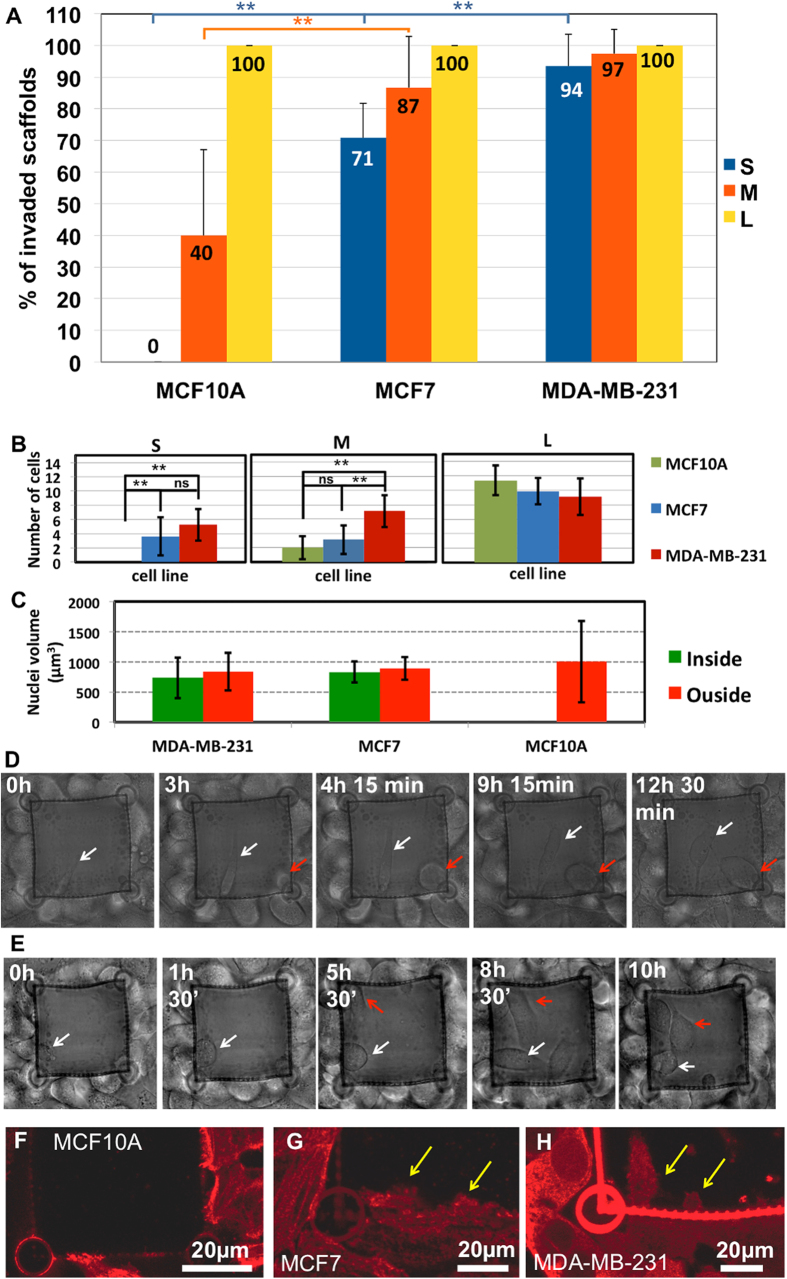
Figure 3. Invasiveness evaluation.
Panel (A) Histogram of the percentage of invaded scaffold for each pore area and cell line. The number of cages used to draw the histogram for S-size cage was n = 25, n = 38 and n = 28 for MCF10A, MCF7 and MDA-MB-231, respectively. In case of M-size cage, it was n = 16, n = 18 and n = 27 for MCF10A, MCF7 and MDA-MB-231, respectively. For L-size cage, it was n = 32, n = 23, and n = 25 for MCF10A, MCF7 and MDA-MB-231, respectively. * p < 0.05, ** p < 0.025 and ns p > 0.05, error bars indicate standard deviation. Panel (B) Histogram of the average number of cells inside invaded scaffolds. n = 8 for each histogram line. * p < 0.05, ** p < 0.025 and ns p > 0.05, error bars are standard deviations. Panel (C) Histogram of the average nuclear volume per cell line evaluated on confocal z-stack images of S-sized pore cages. Volumes were evaluated on n = 10 cells inside the cages and n = 10 cells outside the cages for MCF7 and MDA-MB-231 and n = 20 for MCF10A. Error bars indicate standard deviation. Panels (D–E) Representative frames of the time-lapse experiments with MDA-MB-231 and S-size cages (the corresponding movies are reported as Supplementary Movie 1 and 2, respectively). Red arrows indicate cells entering into the cage by exploiting one of the pillars, while white arrows indicate cells passing through the single pore without interacting with any of the pillars. Panels (F–H) Confocal microscope images of the three cell lines interacting with S-sized cages for MCF10A, MCF7 and MDA-MB-231, respectively. Fluorescence is obtained through immunostaining of myosin IIA as detailed in experimental section.

