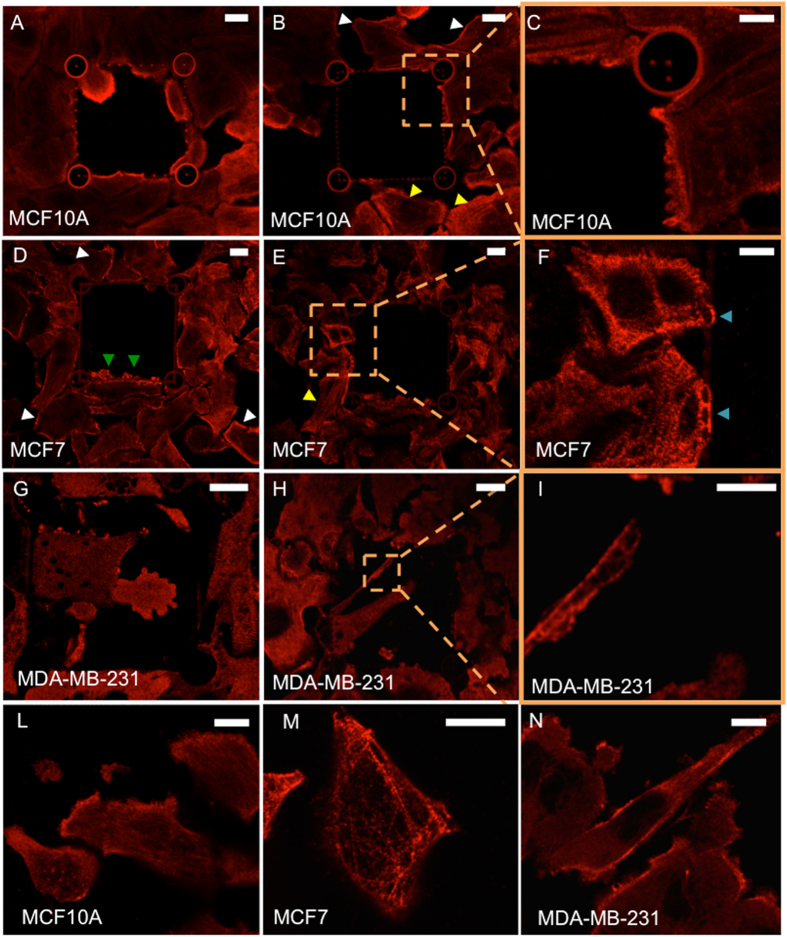
Figure 5. Confocal images of MCF10A, MCF7 and MDA-MB-231 cell lines stained for non-muscle myosin IIA light chain detection.
Panel (A): myosin localization in MCF10A cells entering in a M-sized cage-like structure. Panels (B), (C): myosin aggregates at the cell-cage interface for S pores. Panel (D): cortical myosin distribution of myosin IIA and small multiple myosin-rich invadopodia in MCF7 cells. Panels (E), (F): elongated myosin filaments and aggregates in MCF7 interacting with S pores. Panels (G–I): myosin distribution in MDA-MB-231/GFP cells interacting with a S-sized cage. In panel G a diffused myosin immunostaining is predominant. Panels H and I show small myosin aggregates in correspondence to invadopodia focal points. Panels (L–N): myosin IIA distribution in non-confluent samples. Scale bars represent 10 μm in panels A, B, D, E. G, H, L, M, and N, and 5 μm in panels C, F, I.

