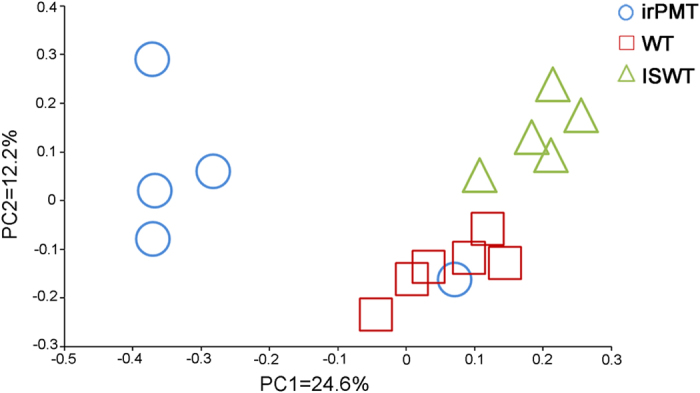
Figure 1. Principal coordinates analysis (PCoA) based on OTU relative abundances of the bacterial community composition in the floral nectar of N. attenuata WT, transgenic N. attenuata irPMT and N. glauca ISWT samples.

The first two principal coordinates (PC1 and PC2) from the principal coordinate analysis of unweighted UniFrac are plotted for each sample. The variance explained by the PCs is indicated on the axes.
