
Figure 2. Betatrophin level distribution according to insulin resistance and FBG.
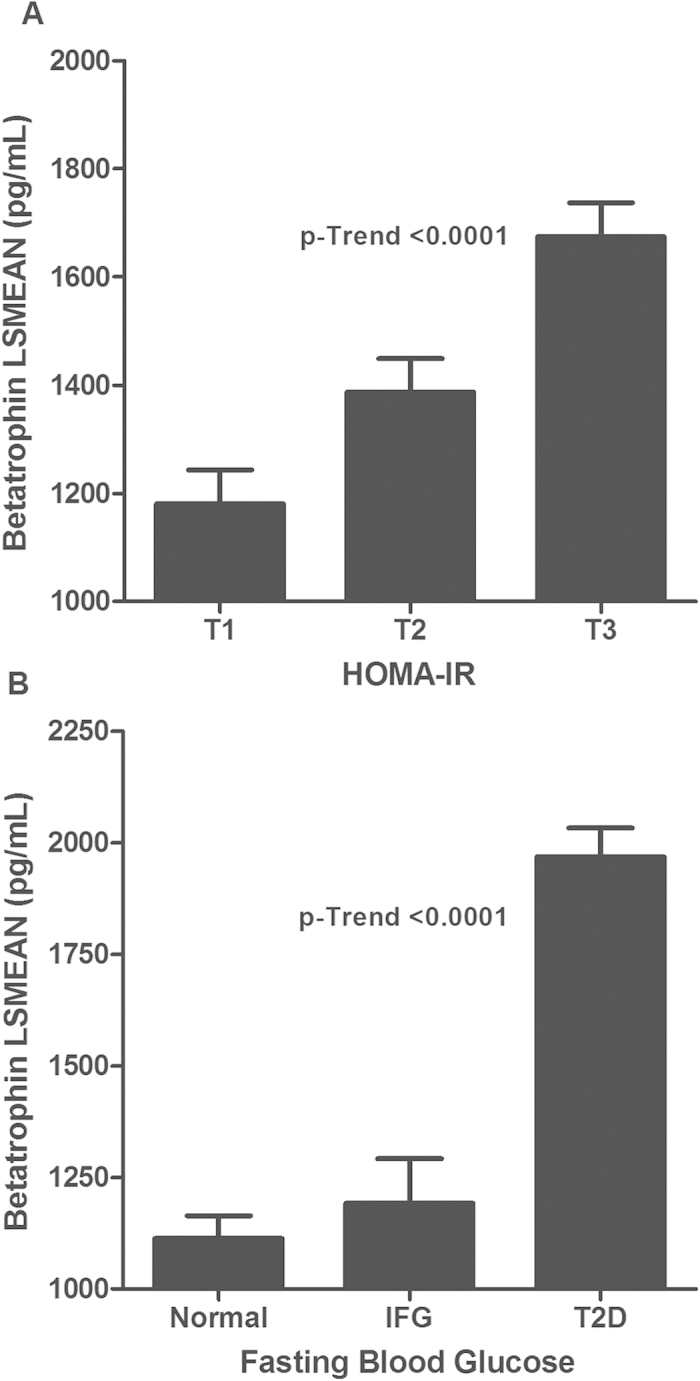
A: Age-, gender-, and ethnicity-adjusted least square means of concentrations of betatrophin according to HOMA-IR. Tertile values of HOMA-IR are expressed as T1 (≤1.6), T2 (>1.6 & ≤3.1), and T3 (>3.1). B: Age-, gender-, and ethnicity-adjusted least square means of concentrations of betatrophin according to FBG and HOMA-IR. T2D: FBG ≥7 mmol/l, under treatment, or self-reported of previously diagnosed T2D; IFG: fasting blood glucose values ≥5.6 and <7 mmol/L. LSMean: Least Square Mean.