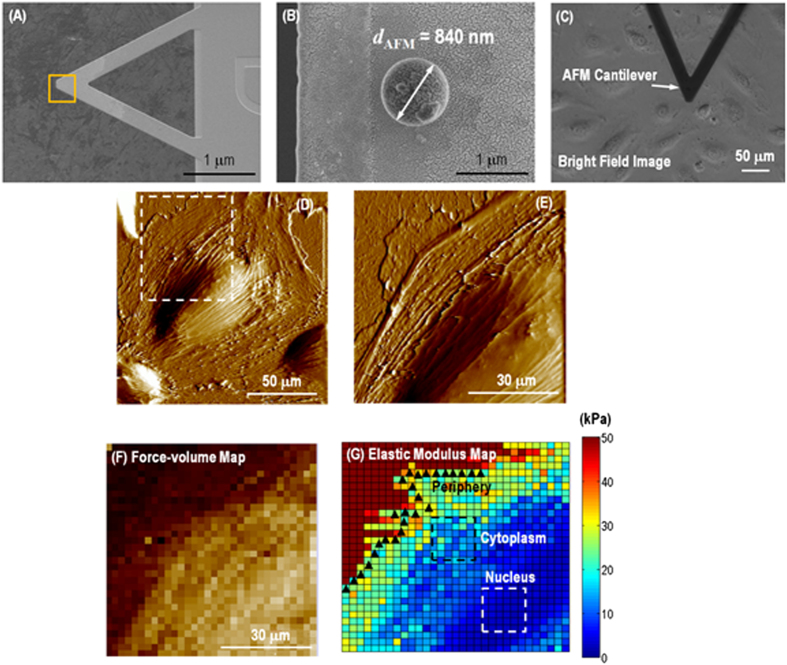
Figure 1. 3-region analysis of force-volume map on a live single cell.
(A) SEM image of colloidal probe with dAFM ~ 840 nm SiO2 sphere attached onto a silicon nitride triangular cantilever. (B) Magnified SEM image of the SiO2 sphere. (C) Bright field optical image indicating colloidal AFM probe doing indentation on a single live cell. (D) A single spreading live cell identified by AFM scanning, showing presumably actin filament stress fibers could be visualized just under the surface of cell member and morphological details. (E) High resolution deflection image showing more morphological details of the regions indicated with square in (D), with all three nuclear, cytoplasmic and peripheral regions represented. (F) A force-volume image generated by the AFM indentation using colloidal probe with 32 × 32 force-displacement curves collected on 70 × 70 μm2 area. (G) Elastic modulus map generated by the force-displacement curve fitting at each pixel based on variable-indentation-depth fitting to Hertzian contact mechanics model for spherical indenter, showing soft cell compared to rigid substrate. 3 different parts were selected by isolating pixels representing the nucleus, cytoplasm and periphery regions.

