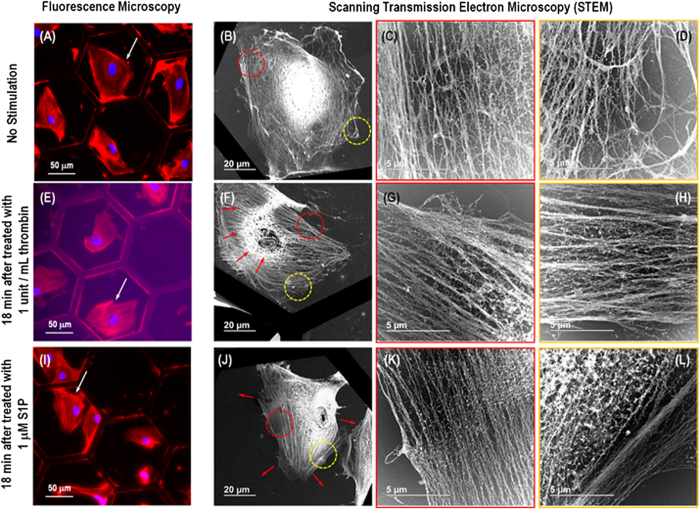
Figure 4. Correlative fluorescence microscopy and STEM images showing the same nano-structures within a single pulmonary EC for both a wider distribution and finer structural details of filaments. Images (A-D), (E-H) and (I-L) correspond to unstimulated, thrombin-treated (1 unit/mL, 18 min) and S1P-treated (1 μM, 18 min) cells, respectively.
(A), (E) and (I) present florescence microscopy images of unstimulated, thrombin-treated and S1P-treated cells, respectively. (B), (F) and (J) are STEM images of the entire unstimulated, thrombin-treated and S1P-treated cell pointed by the white arrows in (A), (E) and (I), respectively. (C-D), (G-H) and (K-L) are zoomed-in STEM images revealing the fine nano-structures of the actin filament in the areas encircled with red and yellow dotted lines in (B), (F), and (J), respectively. The red arrow in (F) indicates the cell after treated by thrombin (1 unit/mL, 18 min) is contracted in shape and that in (J) shows dense cortical actin band resulting from S1P treatment (1 μM, 18 min).

