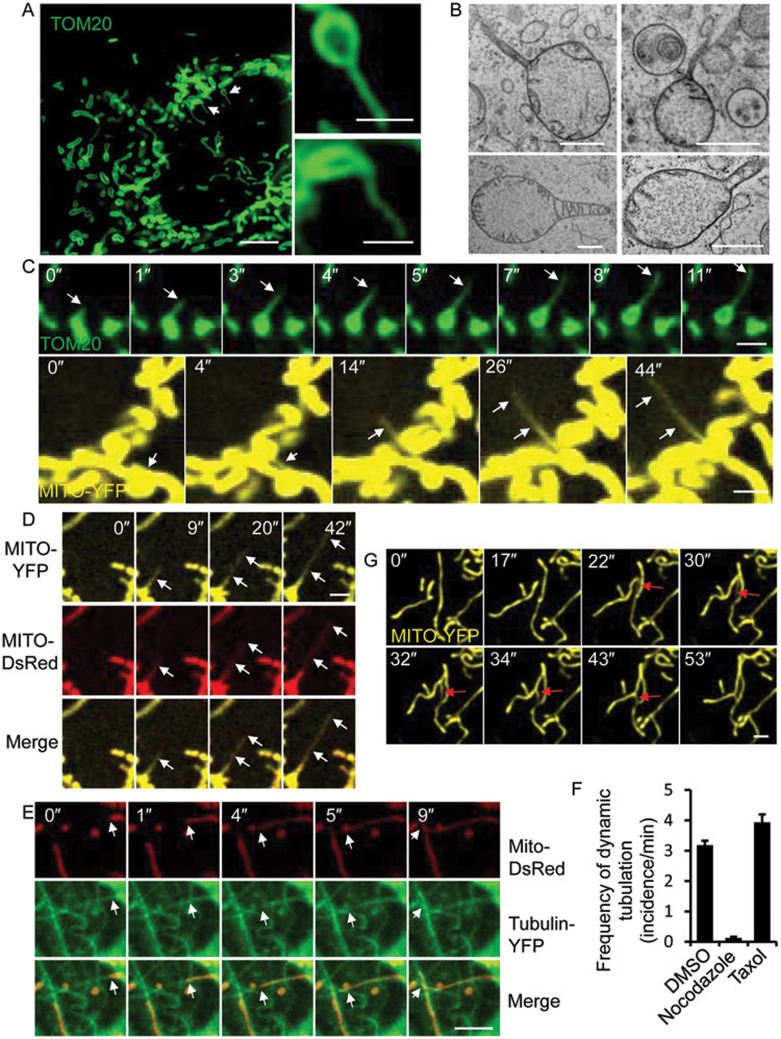
Figure 1.
Dynamic tubulation of mitochondria. (A) NRK cells stably expressing the mitochondrial marker TOM20-GFP were visualized by N-SIM microscopy. Scale bar, 5 μm. Structures indicated by the white arrows are enlarged in the right-hand panels. Scale bar in enlarged panels, 1 μm. (B) NRK cells were observed by high-pressure freezing TEM. Scale bar, 0.5 μm. (C) NRK cells stably expressing the mitochondrial markers TOM20-GFP (top) or Mito-YFP (bottom) were visualized by spinning-disk microscopy. Scale bar, 2 μm. White arrows indicate the tubulation process. (D) Mito-YFP-expressing NRK cells were transfected with the mitochondrial matrix marker Mito-DsRed, and then observed by spinning-disk microscopy. Scale bar, 2 μm. White arrows indicate dynamic tubules. (E) NRK cells were transfected with Mito-DsRed and Tubulin-YFP, and then observed by spinning-disk microscopy. Scale bar, 5 μm. White arrows indicate the tubulation process. (F) Frequency of dynamic tubulation in NRK cells treated with DMSO, nocodazole or taxol was quantified. n = 90 cells from three independent experiments. Error bars indicate SD. (G) NRK cells stably expressing Mito-YFP were visualized by spinning-disk microscopy. Scale bar, 2 μm. Red arrows indicate a tubulation event that mediates fusion of two mitochondrial tubules.

