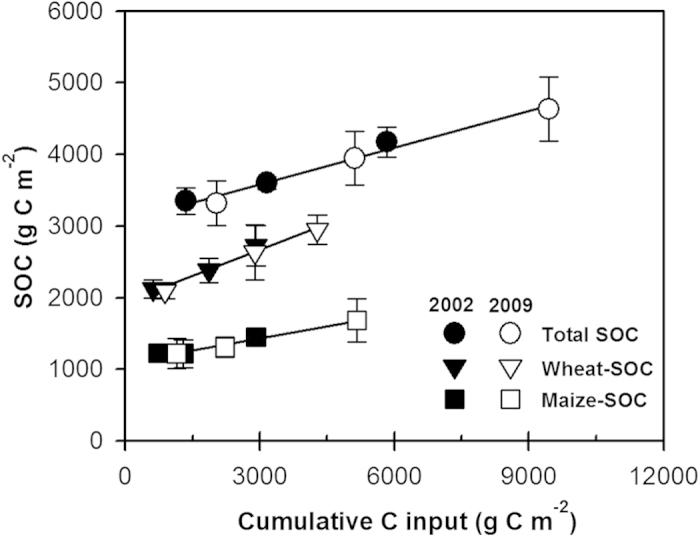
Figure 6. Relationships between SOC stocks in 0–40 cm for 2002 (2009) and cumulative C inputs during 1990–2002 (1990–2009), using the averages of all sites.

The error bars denote standard deviations. Maize-SOC: y = 0.112x + 1102, R2 = 0.97; Wheat-SOC: y = 0.244x + 1937, R2 = 0.98; Total SOC: y = 0.170x + 3073, R2 = 0.98.
