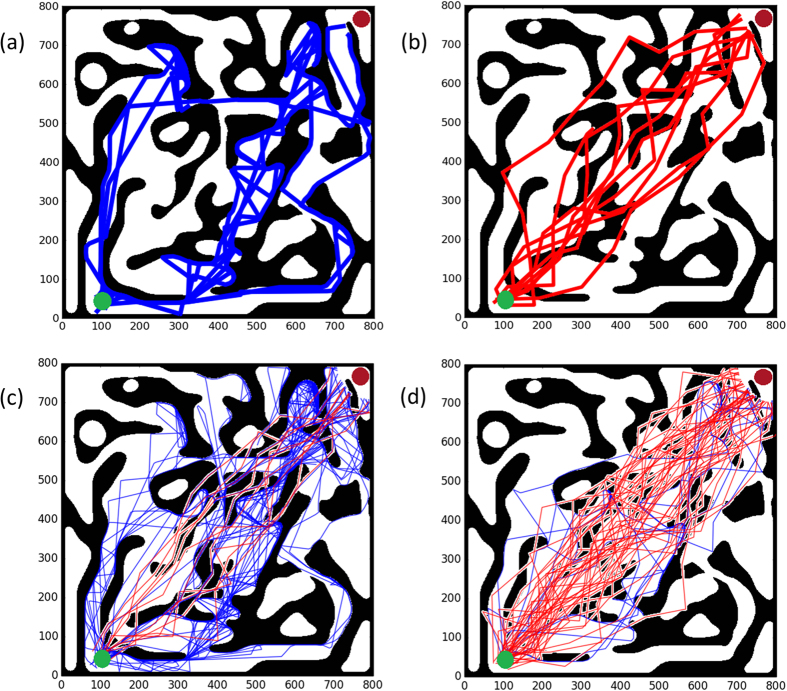
Figure 2.
Trajectories. (a)–(b) Typical trajectories of 10 amoeboid (a) and mesenchymal (b) agents. (c)-(d) The trajectories of amoeboids (blue) and mesenchymal (red) cells for q = 1 and two different population distributions: (a) 20% mesenchymals and 80% amoeboids; (b) 80% mesenchymals and 20% amoeboids.

