
Figure 2. Syntenic relationships between A. thaliana and R. sativus (a) and between B. rapa and R. sativus (b) based on the ABC genomic blocks.
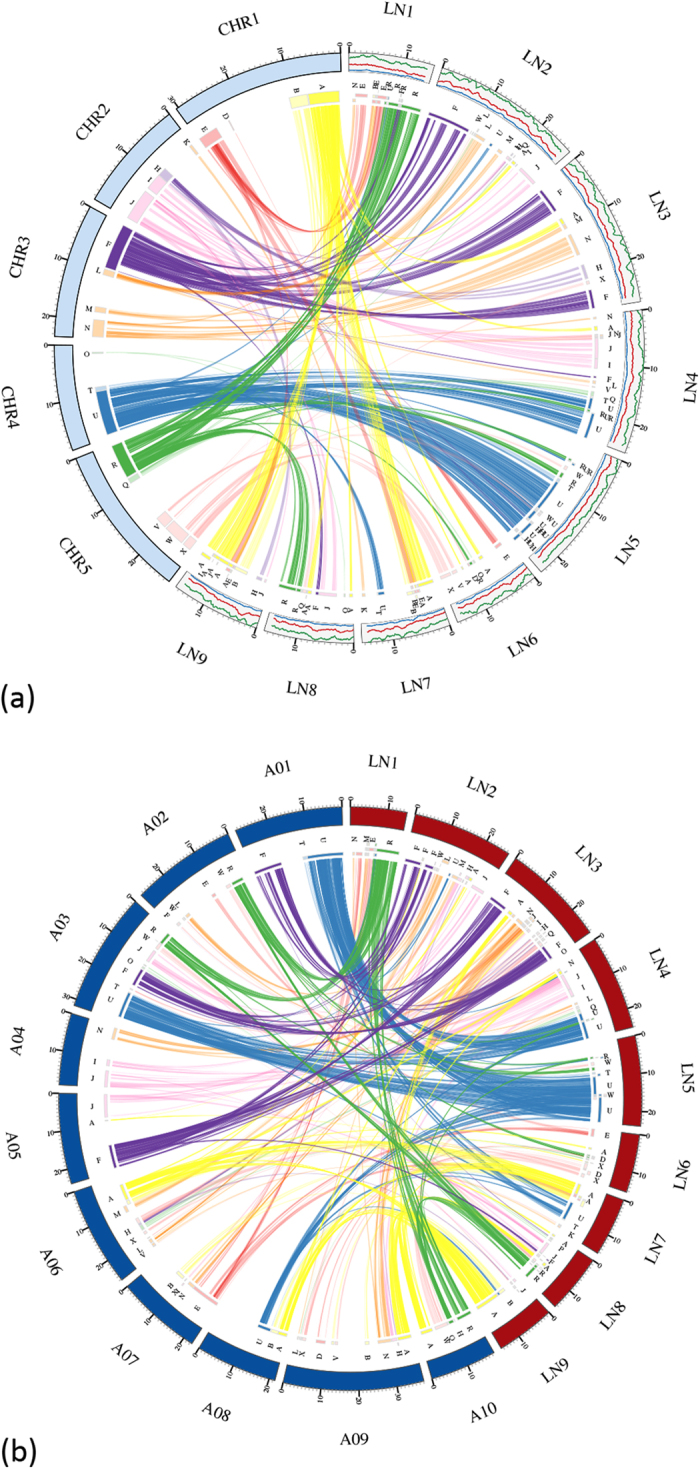
The left arc represents A. thaliana and the right arc shows the line chart for repeat density. Red: retrotransposon, blue: DNA transposon, green: other repeat sequences.