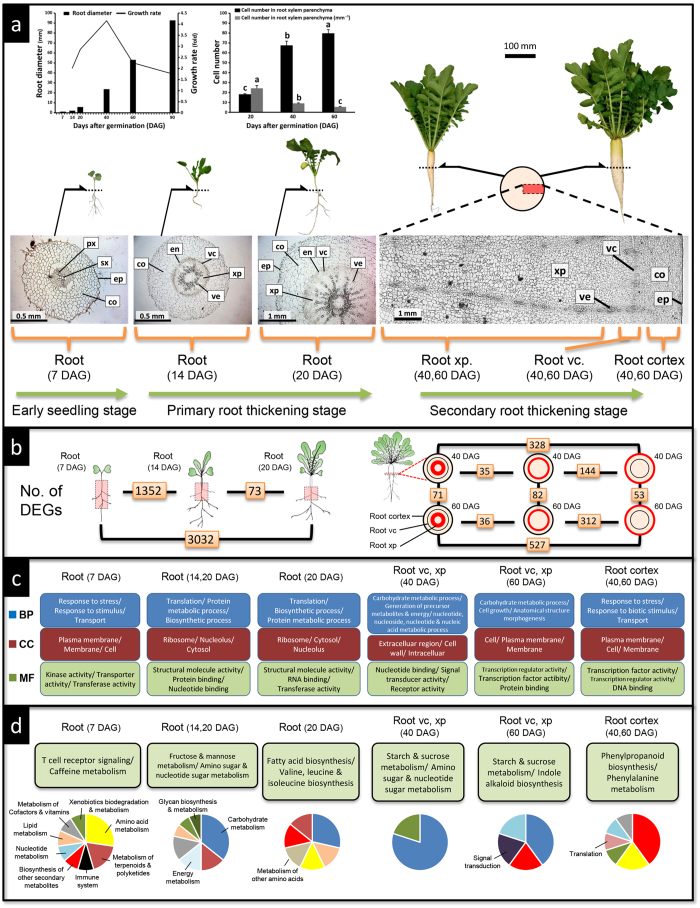
Figure 3. The process of root tuberisaiton of R. sativus var.hortensis cv. Aokubi and gene expression patterns at key developmental stages and tissues.
(a) Root thickening and cell proliferating processes in 7, 14, 20, 40 and 60 days after germination (DAG) roots. Changes in root diameter, growth rate and cell number in xylem parenchyma tissue of 7–90 DAG roots are presented. Bar = SD. Letters represent significant differences among growing stages (ANOVA post hoc Tukey HSD, P < 0.01).Transverse section of roots are shown; px: primary xylem, sx: secondary xylem, co: root cortex, ep: epidermis, xp: xylem parenchyma, vc: root vascular cambium, en: endodermis, ve: vessel. (b) Number of differentially expressed genes (DEGs) in 7, 14, 20, 40 and 60 DAG roots and tissues. (c) Significantly enriched GO categories for upregulated genes in each developmental stage and tissue. The top three categories of biological process (BP), cellular component (CC) and molecular function (MF) are shown. (d) Significantly enriched KEGG pathways for upregulated genes in each developmental stage and tissue. The top three pathways are shown. Photographs were taken by Y. Mitsui.

