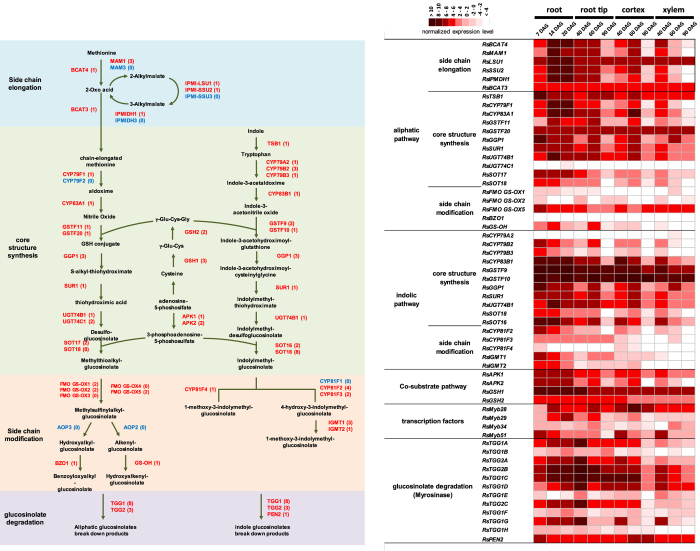
Figure 4. Glucosinolate biosynthesis and degradation genes in R. sativus.
(a) Glucosinolate biosynthesis and degradation pathway. The number of genes in the genome is noted in brackets. Orthologues identified in R. sativus are marked in blue colour. The absence genes in the genome are marked in red. (b) Comparison of transcriptional profiles for glucosinolate biosynthesis and degradation genes. Heat maps show log2-scaled reads per kilobase per million reads (RPKM) for biosynthetic genes.

