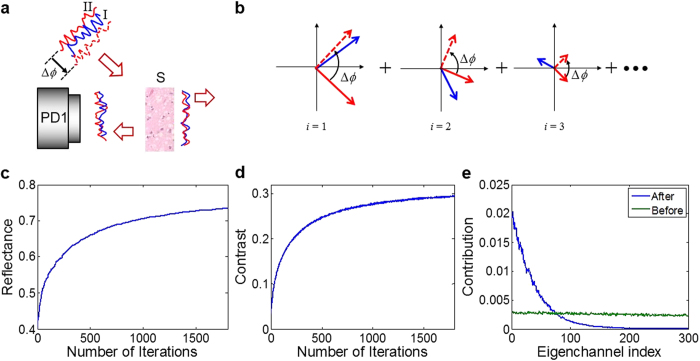
Figure 1. Theoretical analysis of purifying reflection eigenchannels with high reflectance.
a, Schematic diagram of maximization process. The incident wave was decomposed into two parts indicated by I and II, and the second part is shifted in phase by Δϕ. A detector sensor (PD1) records the reflected wave by a scattering sample (S). b, Phasor diagrams for the reflection eigenchannels. From left to right, the eigenchannel index is increasing such that the length of phasor decreases. Red and blue phasors indicate waves coming from parts I and II of the incident wave, respectively. Dashed red arrows show the phasors of solid red arrows after a phase shift of Δϕ c, Total reflectance with the increase of the number of iterations. d, Contrast of modulation with respect to Δϕ at each step of iteration. e, Square of normalized correlation between an incident wave and eigenchannels at the input plane. Green and blue curves correspond to the incident waves before and after the purification process, respectively.

