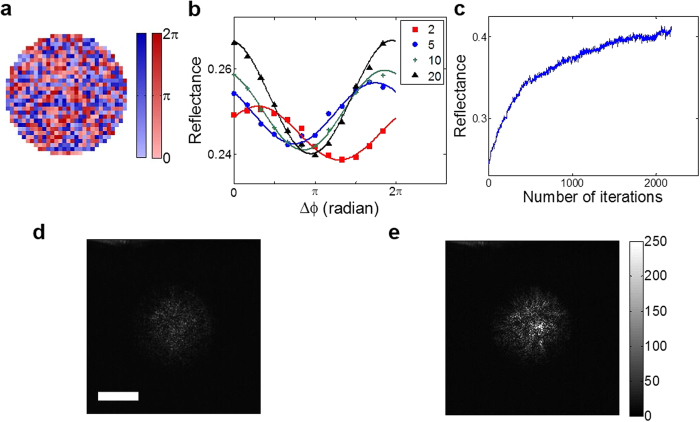
Figure 3. Experimental results of the preferential coupling to high-reflection eigendmoes.
a, Representative phase pattern written on SLM. Pixels colored in blue constitute part I, and those in red constitute part II. Color bar, phase in radians. b, Experimentally measured total reflection as a function of Δϕ at the iteration steps of 2, 5, 10, and 20. c, Experimentally measured reflectance over the increase of the number of iterations. d and e, The intensity images of the transmitted wave before and after the purification process, respectively. Scale bar, 5 μm. Color bar indicating intensity in arbitrary units applies to both d and e.

