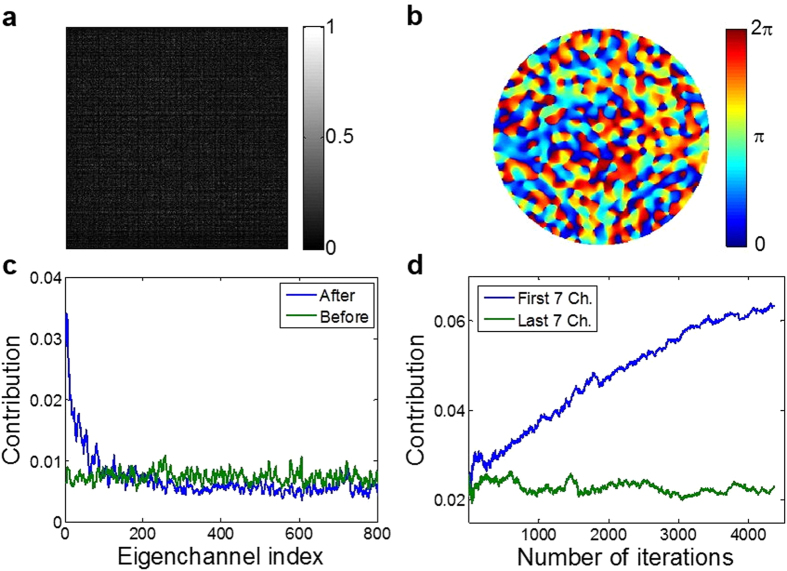
Figure 4. Enrichment of high-reflection eigenchannels due to the purification process.
a, Amplitude part of the reflection matrix recorded by the setup shown in Fig. 2. Column and row indices indicate input and output channels, respectively. b, One of the representative reflection eigenchannels having the highest reflectance. Only the phase map is shown here, and there is an associated amplitude map. c, The contribution of each eigenchannel to the incident wave before (green) and after (blue) the purification process. d, The contribution to the incident wave of the first 7 eigenchannels (blue) and last 7 eigenchannels (green) with respect to the number of iterations.

