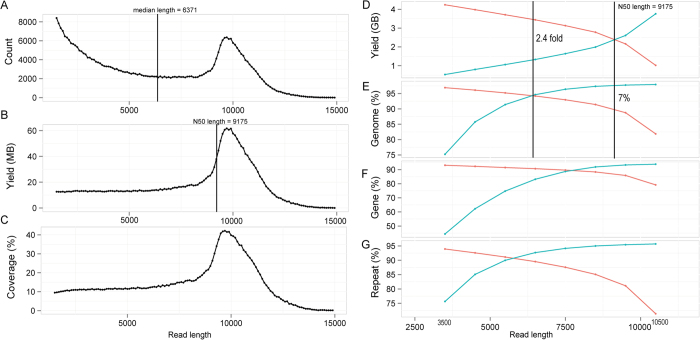
Figure 2. Read count and mappability across its lengths.
(A, B and C) Count, yield and genomic coverage of long read across its lengths respectively with a window size of 100 bp. (D, E, F and G) Accumulative read yield and its coverage of genome, protein-coding genes and repetitive sequences across read lengths respectively. Blue and red lines represent accumulative yield or percentage respectively using the reads shorter or longer than a given read length.

