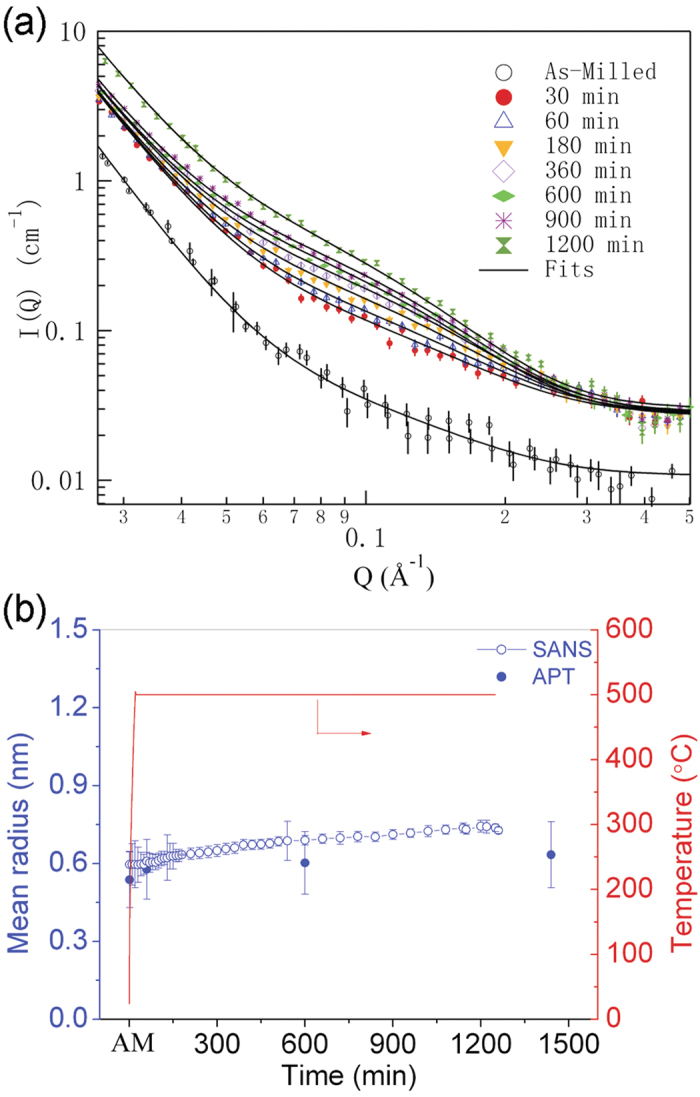
Figure 3.

(Zhang). (a) Selected SANS-intensity distribution as a function of scattering vector. The solid lines denote the fitting results. (b) The nanocluster size determined by in situ SANS as a function of annealing time, along with independent estimates from APT data. The temperature profile for in situ SANS measurements is also shown in Fig. 3b.
