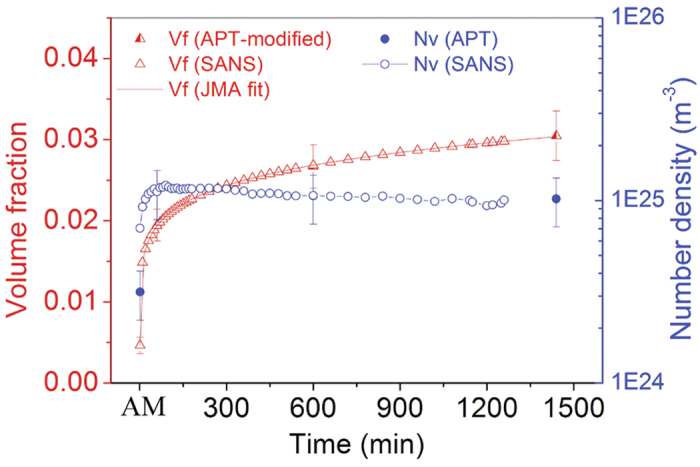
Figure 4.

(Zhang). The number density and volume fraction determined from SANS and APT data. The solid line denotes the John-Mehl-Avrami (JMA) fitting results. The fit yielded an exponent n = 0.142 ± 0.004.

(Zhang). The number density and volume fraction determined from SANS and APT data. The solid line denotes the John-Mehl-Avrami (JMA) fitting results. The fit yielded an exponent n = 0.142 ± 0.004.