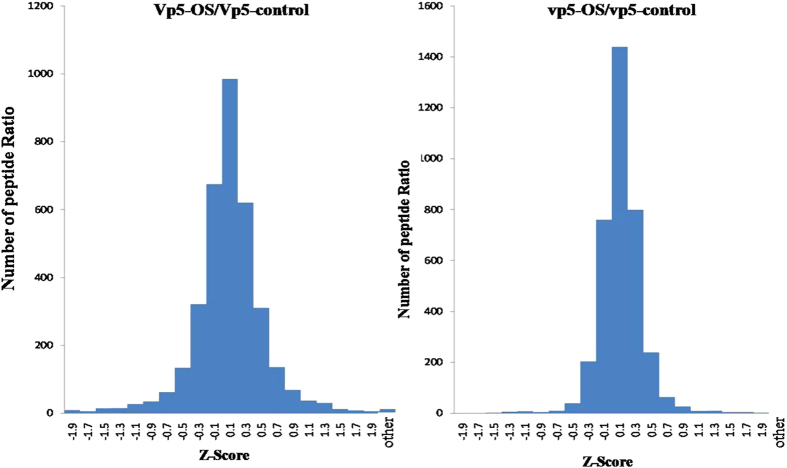
Figure 3. Z-scores frequency distribution of differential peptides in maize wild type Vp5 and mutant vp5 under osmotic stress.
iTRAQ ratios between osmotic stress (OS) and controls for each run were converted to z-scores to normalize the data. Positive z-score values represent proteins up-regulated by OS and negative values represent proteins down-regulated by OS. Z-scores between −0.9 and 0.9 indicates proteins not significantly altered, between ±0.9 and 1.96 moderately altered, and ≥1.96 and ≤−1.96 significantly altered ≥2-fold during osmotic stress (>95% confidence).

