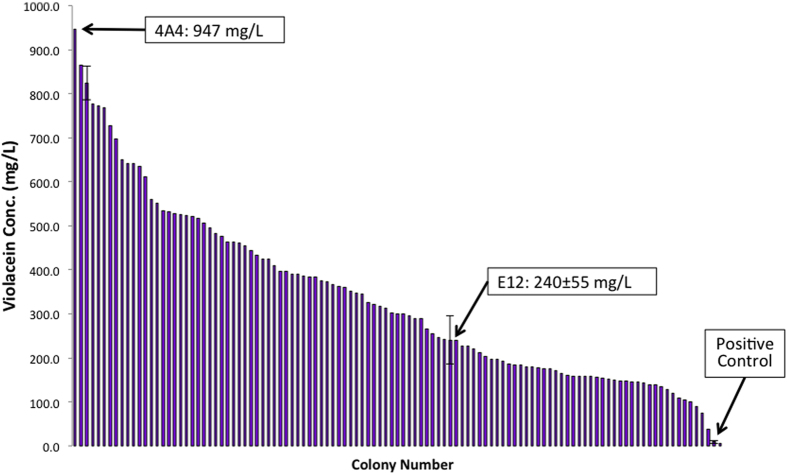
Figure 5. Screening of enriched violacein production library.
Substantial improvements are seen when compared to the initial screen (Fig. 3). Mutant E12 (top mutant from initial screen), positive control, and the top mutant 4A4 are highlighted. All screening was performed using E. coli BL21starTM(DE3) in LB Media at 30 °C. Cultures were induced after 4.5 h of growth with 1 mM IPTG. Violacein was analyzed by HPLC after methanol extraction. Error bars represent ±1 standard deviation of biological duplicate.

