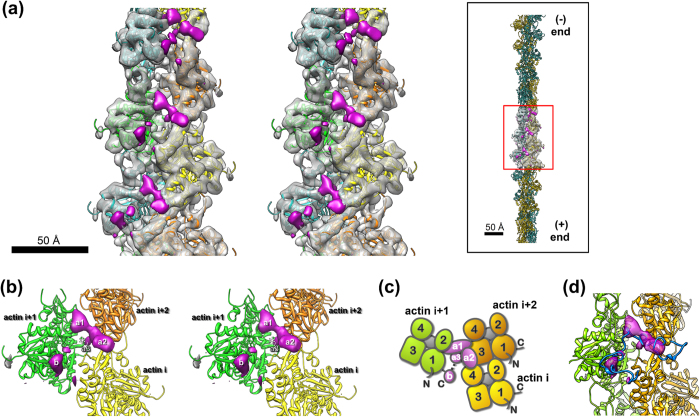
Figure 2. Structure of the F-actin/VopVrep1 complex visualized by cryoEM image analysis at 9.6-Å resolution.
(a) A magnified view of the F-actin/VopVrep1 complex in stereo. The long axis of the actin filament is vertical, as shown in the inset. The density map is represented as a transparent envelope and is filled by actin models that are alternately colored cyan/green and orange/yellow according to the two actin strands. The extra regions that likely correspond to VopVrep1 are colored magenta. For clarity, the extra density derived from the N-terminal region of actin was colored dark gray. Three repetitive clusters are observed in this view. (b) Detailed stereo view of the VopVrep1 densities on the F-actin model. Three distinguishable densities, a1, a2, and b, were in close contact with three actin units i, i + 1, and i + 2. (c) A schematic representation of the relative spatial arrangement of the VopVrep1 densities (magenta) and surrounding actin domains numbered 1-4 with ATP/ADP (gray). (d) A binding model of VopVrep1 (blue) in an elongated form, fitted to the observed densities. The chains outside the densities would be unstructured.

