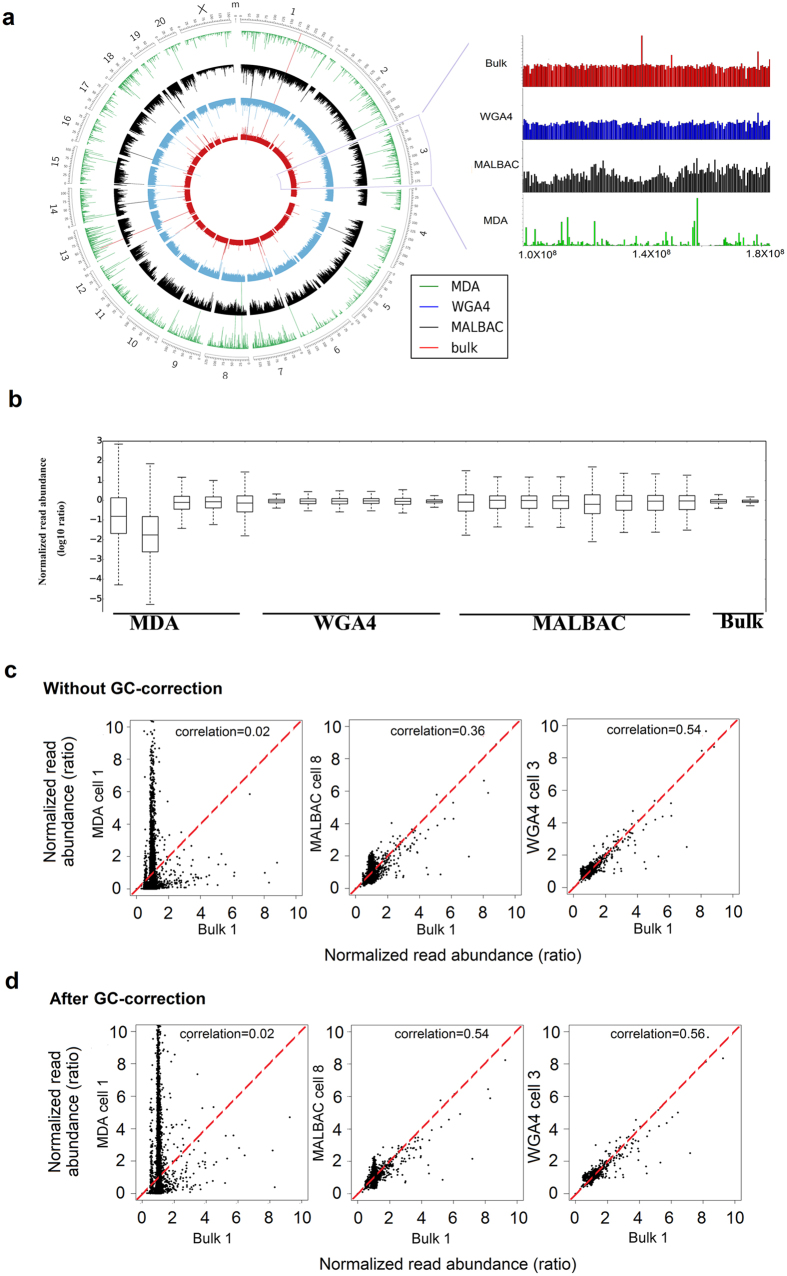
Figure 4. Read abundance.
(a) Read abundance distribution across the genome from three single-cell amplification methods and a bulk-cell sample (left) and a magnified plot of part of chromosome 3 (right). The five circles from outside to inside are the chromosome position index, read abundance of MALBAC (black), read abundance of WGA4 (blue), and read abundance of the bulk-cell sample (red). Each bar represents the total reads in a 500 kb bin, and all 5,797 bins are plotted. (b) Box plot representing the normalized reads in 5,797 bins in log10 scale. x-axis are all 19 single cells and bulk sample. y-axis are the average, 25th (Q1), 50th, and 75th (Q3) percentiles of normalized reads for each sample. (c,d) Correlation between the three single-cell amplification methods and the bulk-cell sample without GC-correction (c) and with GC correction (d) in autosome region. The normalized read abundance in a bin of one sample is the x-value and the normalized read abundance of another sample is the y-value. The combination of these two values will give one dot on the plot for a particular bin. A narrow distribution of dots along the y = x (red line) indicates good correlation between a single-cell method and the bulk-cell sample. For each method, one particular cell is chosen for this plot. Supplementary Fig. S4 illustrates the results for all of the other cells.

