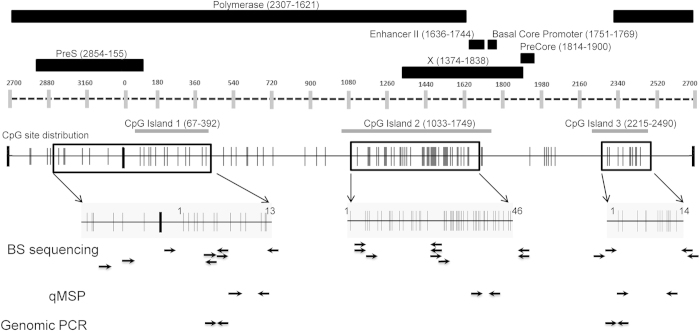
Figure 1. Diagram of the HBV genome indicating the location of the three CpG islands, CpG site distribution, and the primers for PCR assays used in this study.
Black rectangles represent the HBV regions; polymerase, enhancer II, basal core promoter, precore, pre-S and X gene. These regions correspond to the dashed line representing the HBV genome with vertical gray bars indicating nucleotide location. The three CpG islands are indicated by horizontal grey bars below the dashed line. The CpG site distribution in the HBV genome (solid black line) is depicted by vertical grey lines each representing an individual CpG site. The boxes with black borders on the CpG distribution map indicate the regions targeted by the bisulfite sequencing PCR and are enlarged below for better resolution of the CpG sites. The numbering of the CpG sites in the enlarged regions corresponds to that used in Fig. 2. The arrows below this enlarged bisulfite sequencing region indicate primer locations for the specified PCR assays. Detailed primer information is available in Supplementary Table S3.

