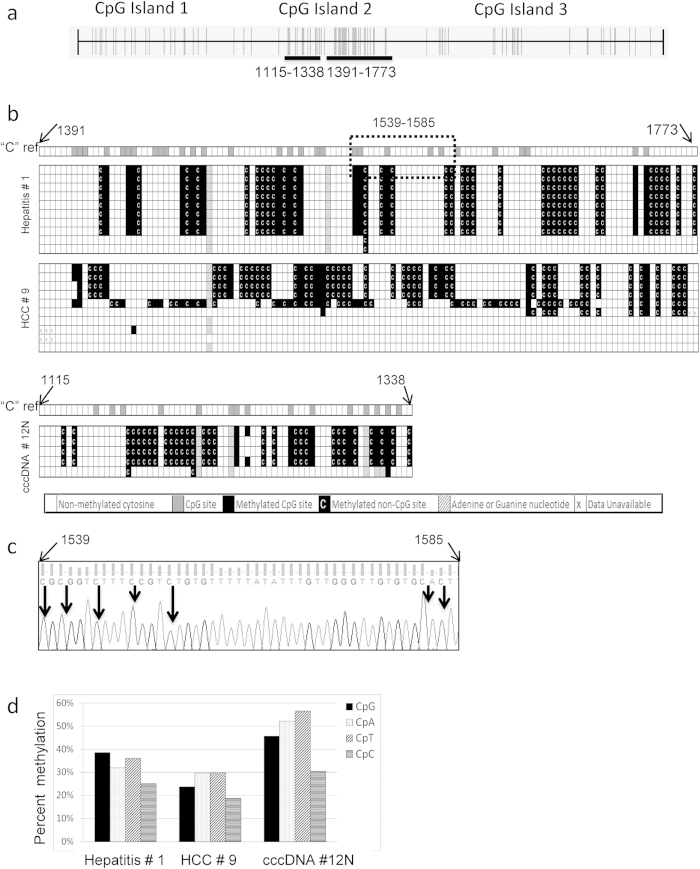
Figure 3. Evidence of non-CpG methylation in the HBV genome from infected livers.
(a) CpG distribution map of the HBV genome depicting each individual CpG site by a vertical line. Horizontal black bars illustrate the regions that were identified as containing non-CpG methylation (nt. positions 1115-1338 and 1391-1773). (b) The locations of non-CpG methylation as referred to the cytosine map (“C” ref). For the boxes corresponding to “C” ref each box indicates a cytosine site in which an open box indicates a non-CpG cytosine (CpA, CpT, or CpC) and a grey box indicates a CpG cytosine (CpG). The samples are numbered as in Fig. 2. The bisulfite sequencing of each clone is presented below the “C” ref. A filled box indicates a methylated CpG site. A filled box with a white C indicates a methylated non-CpG cytosine. An open box indicates unmethylated cytosine. A hatched box indicates a change in the sequence to adenine or guanine. Boxes with an “x” indicate invalid sequencing data. (c) Example of the sequencing chromatogram (nt. 1539-1585) of the hepatitis #1, clone 1, as indicated by the dotted box in Fig. 3b. Arrows indicate methylated cytosine dinucleotides. (d) The percentage of methylation at both CpG and non-CpG sites (CpA, CpT and CpC) as observed in the three liver samples obtained from hepatitis # 1, HCC # 9 and cccDNA # 12N.

