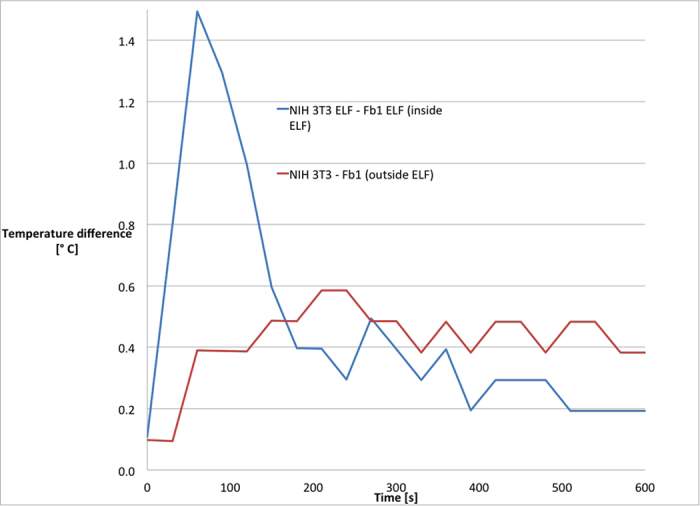
Figure 3. Differences in thermal dispersion of cells inside and outside the electromagnetic field.

Primary fibroblasts (FB1) and NIH3T3 cells were analysed after 6 days of exposure to electromagnetic field or regular culture condition. Values of ΔT were calculated for each well. Values of NIH3T3 cells were compared with values of primary fibroblasts seeded on the same plate. Temperature difference: TNIH3T3 − TFb.
