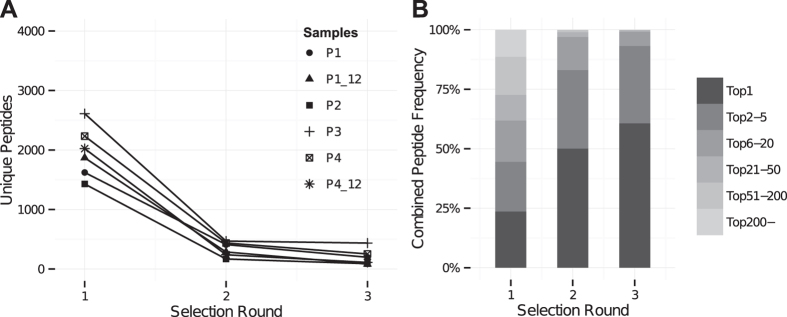
Figure 2.
(A) A plot of the number of unique peptides identified in each patient sample for selection round 1–3. In the first selection round an average of 1827 (sd = 642) unique peptides were obtained, dropping to 313 (sd = 150) and finally 170 (sd = 111) unique peptides after the second and third selection round, respectively. Results were similar for control samples as shown in Supplementary Fig. S3. (B) A stacked bar chart showing the combined frequency of certain rank intervals. Specifically, the frequency of the most frequent peptide (Top1) along with the combined frequencies of the peptides ranked 2–5, 6–20, 21–50, 51–200 and below 200. The average of the combined frequencies for all patients is shown. Results were similar for control samples as shown in Supplementary Fig. S3.

