Figure 3.
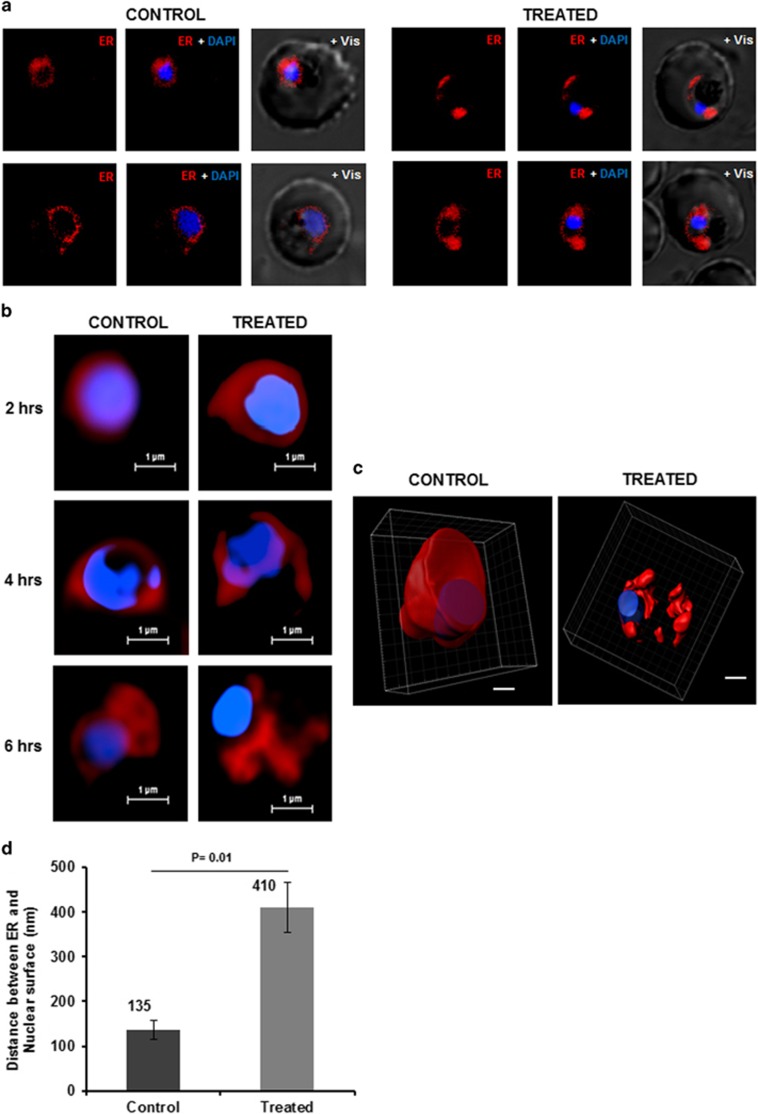
Altered morphology of ER and release of stored calcium in P. falciparum parasites under prolonged proteosomal inhibition. (a) Fluorescent microscopic images of P. falciparum parasites stained with ER Tracker Red at 6 h after treatment with MG132. The parasite nuclei were stained with DAPI (blue). (b) Super resolution microscopic images at different time points (2, 4, 6 h) after MG132 treatment. The parasite showed a disrupted ER network at 4 and 6 h as compared with control that showed a continuous ER around the nucleus. (c) 3D images reconstructed using Z-stacks of ER Tracker stained control and treated parasites. (d) Bar graph showing increase in distance between nuclear and ER surface as assessed by super-resolution microscopic images in MG132-treated parasites as compared with control

