Figure 1.
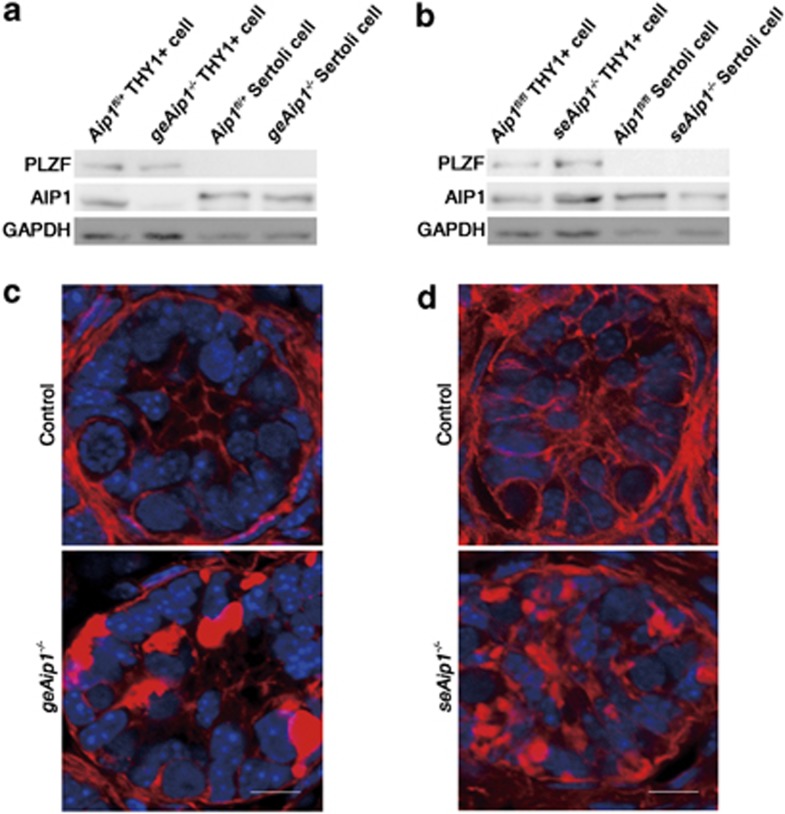
Reduction of AIP1 level and increase of F-actin level as the results of Aip1 deletion in either Sertoli cells or germ cells. (a and b) Western blot analysis of AIP1 protein levels in isolated THY1+ germ cells from geAip1−/− testes at P7 (a) and isolated Sertoli cells from seAip1−/− testes at P7 (b). The control for (a) is THY1+ germ cells from Aip1fl/+ testes and it is compared with THY1+ germ cells from geAip1−/−. The control for (b) is Sertoli cells from Aip1fl/fl testes and it is compared with Sertoli cells from seAip1−/− (c and d) Representative confocal images of phalloidin staining (red) of tissue sections from the P7 controls, geAip1−/− (c) and seAip1−/− (d) testes. Cell nuclei were stained with DAPI (blue). Scale bars: 10 μm

