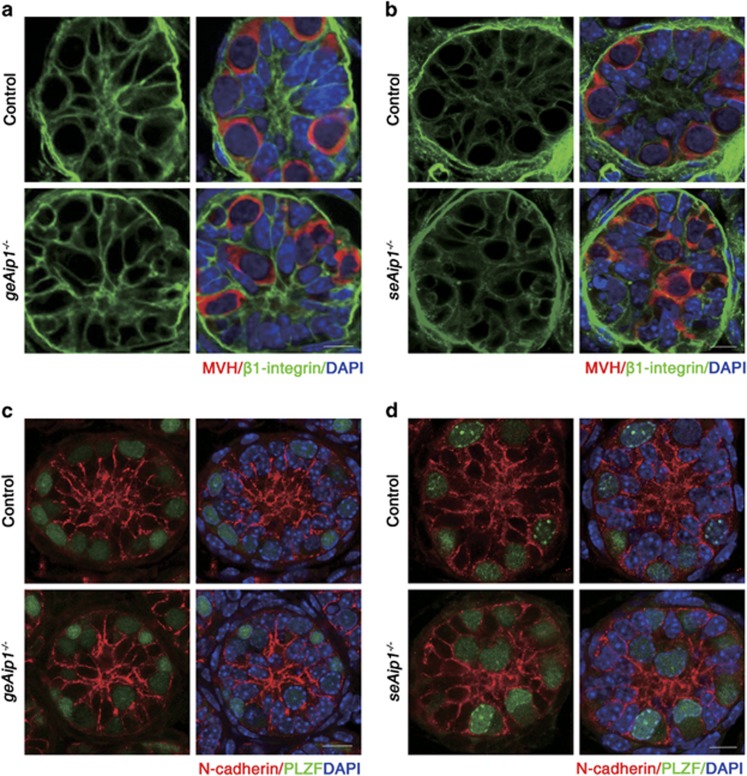
Figure 6.
The distribution patterns of N-cadherin and β1-integrin were not significantly affected. (a and b) Co-immunostaining of β1-integrin (green) and MVH (red) of testis sections from the P7 control, geAip1−/− (a) and seAip1−/− (b) mice. (c and d) Co-immunostaining of N-cadherin (red) and PLZF (green) of testis sections from the P7 control, geAip1−/− (c) and seAip1−/− (d) mice. Scale bars: 10 μm

