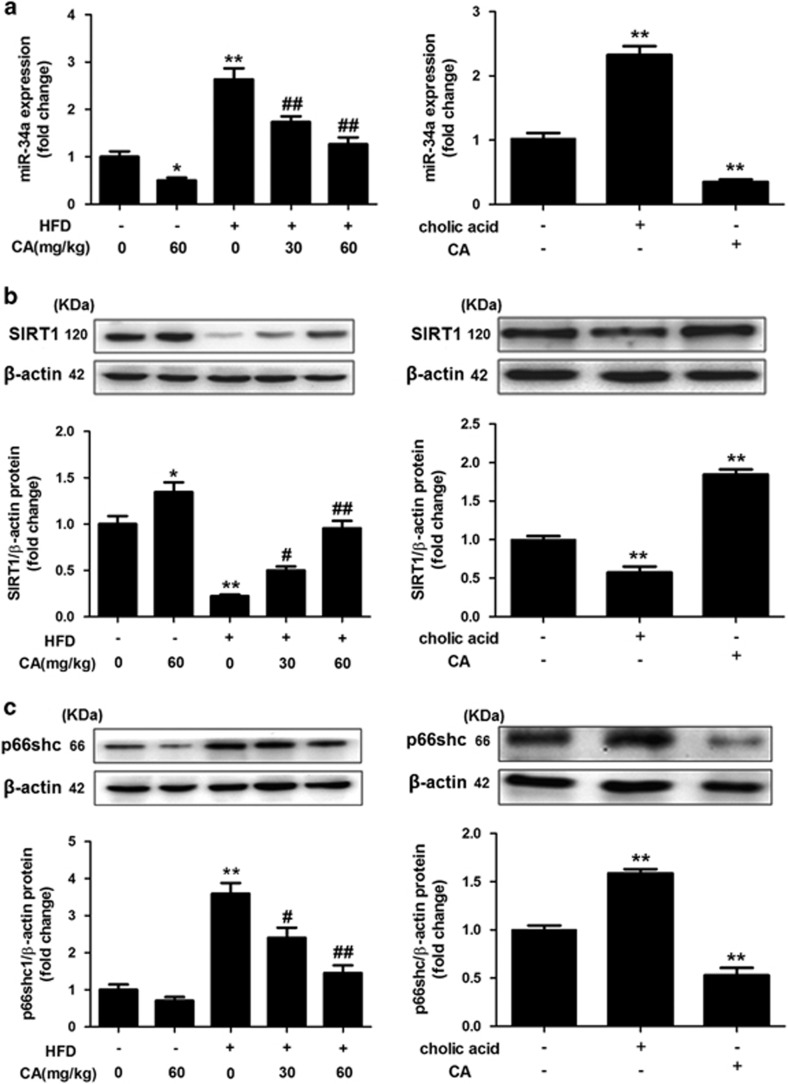
Figure 2.
CA decreases miR-34a expression and activates the SIRT1/p66shc pathway in rat liver and L02 cells. (a) qRT-PCR analysis of miR-34a expression in the liver (left panel) and L02 cells (right panel). (b) SIRT1 protein expression in the liver (left panel) and L02 cells (right panel). (c) p66shc protein expression in the liver (left panel) and L02 cells (right panel). L02 cells were treated with CA, cholic acid or nothing. The data are presented as the mean±S.D. (n=3). *P<0.05 versus the ND group, **P<0.01 versus the ND group, #P<0.05 versus the HFD group, ##P<0.01 versus the HFD group

