Figure 5.
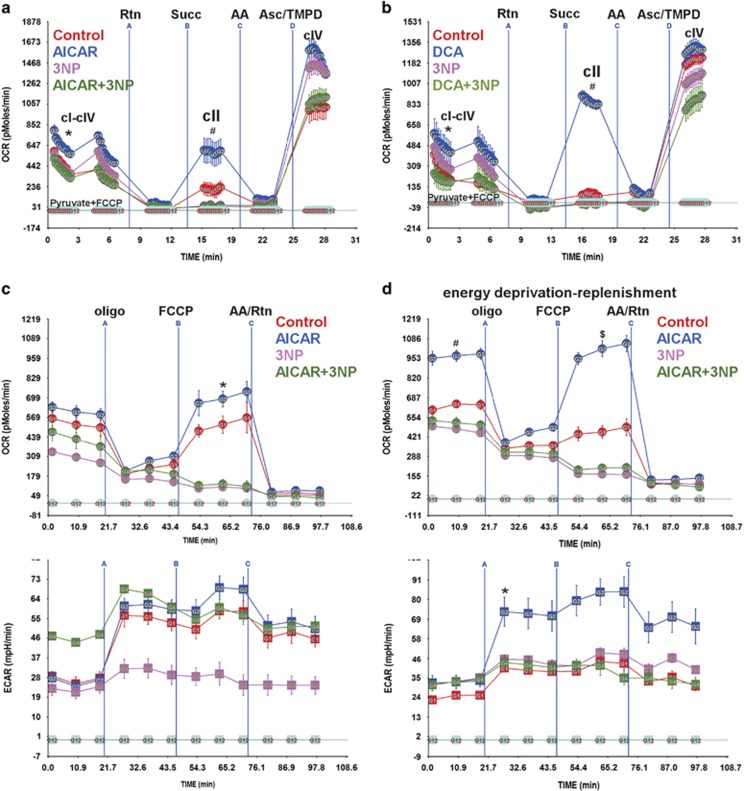
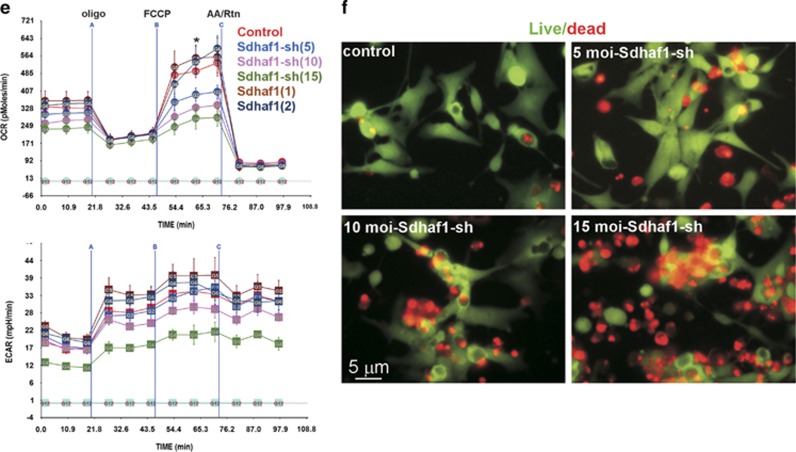
RRC is a product of cII activity and is utilized after energy deprivation. (a and b) Neonatal rat cardiac myocytes cultured in complete growth medium were treated with vehicle, 500 μM AICAR (a) or 1 mM DCA (b), for 24 h. Vehicle or 100 μM 3NP was added for the last 1 h of this incubation. The cells were then permeabilized with 0.5 nM PMP reagent (rPFO) in the presence of 10 mM pyruvate, 2 mM malate and 4 μM FCCP, for 30 min. The electron flow assay was then performed as described in Materials and Methods, as indicated, n=4–6, error bars represent S.E.M., each experiment was performed twice. Error bars represent S.E.M., *P<0.05 basal OCR for AICAR or DCA treated versus basal OCR for control, at the time point indicated; #P<0.05 max OCR for AICAR or DCA treated versus max OCR for control, at the time point indicated. (c and d) Neonatal rat cardiac myocytes cultured in complete growth medium were treated with vehicle or 500 μM AICAR, for 24 h. Vehicle or 100 μM 3NP was added and the cells either remained in normoxic conditions (atmospheric O2) (c) or were exposed to hypoxia (<1% O2) and glucose deprivation (d), for 1 h. At the end of this period, the medium was then replaced with serum-free XF medium containing 17.5 mM glucose plus 100 μM palmitate-BSA containing vehicle, 500 μM AICAR, 100 μM 3NP or 500 μM AICAR plus 100 μM 3NP, for 1 h. The mitochondrial stress test was then performed as described in Materials and Methods, n=4–6, each experiment was performed twice. Error bars represent S.E.M., *P<0.05 max OCR versus basal OCR for AICAR-treated cells, at the time point indicated; #P<0.05 basal OCR for AICAR treated versus basal OCR for control, at the time point indicated; $P<0.05 max OCR for AICAR treated versus max OCR for control, at the time point indicated. (e) Neonatal rat cardiac myocytes (50 000–100 000/well) cultured in complete growth medium were infected with adenoviral vectors harboring a scrambled control sequence, shRNA targeting Sdhaf1 (5, 10, 15 moi) (Sdhaf1-sh), or an Sdhaf1 overexpressor (1, 2 moi), for 24 h. The medium was then replaced with serum-free XF medium containing 17.5 mM glucose plus 100 μM palmitate-BSA, for 1 h. The mitochondrial stress test was then performed as described in Materials and Methods, n=3–4. Error bars represent S.E.M., *P<0.05 max OCR control versus max OCR for Sdhaf1-sh treated (all doses), at the time point indicated. (f) Cells treated as described in (e) were subjected to a live (green)/dead (red nuclei) assay and imaged


