
Figure 2.
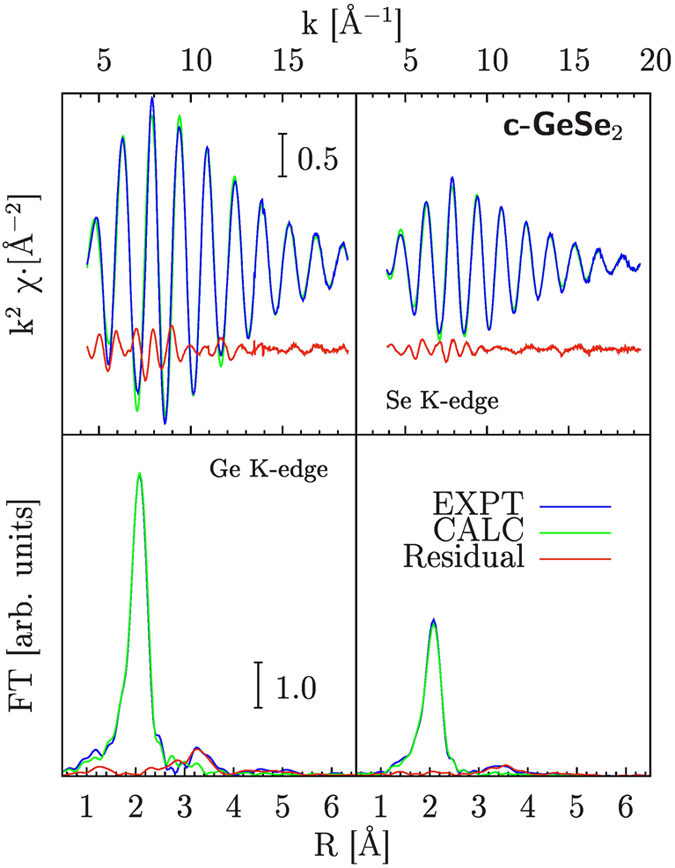
Ge (Left) and Se (Right) K-edge XAS spectra of crystalline GeSe2 (c-GeSe2). Experimental (EXPT) and best-fit calculations (CALC), accounting for the dominant signal associated with the first-neighbor Ge-Se distribution, are compared. The Fourier Transform (FT) of both signals showing a prominent peak at about 2 Å related to the Ge-Se first-neighbors, is compared in the lower panels. The differences between experimental and calculated spectra (Residual curves) are weak oscillating signals associated with more distant neighbor distributions (above 3 Å in the FT spectra).