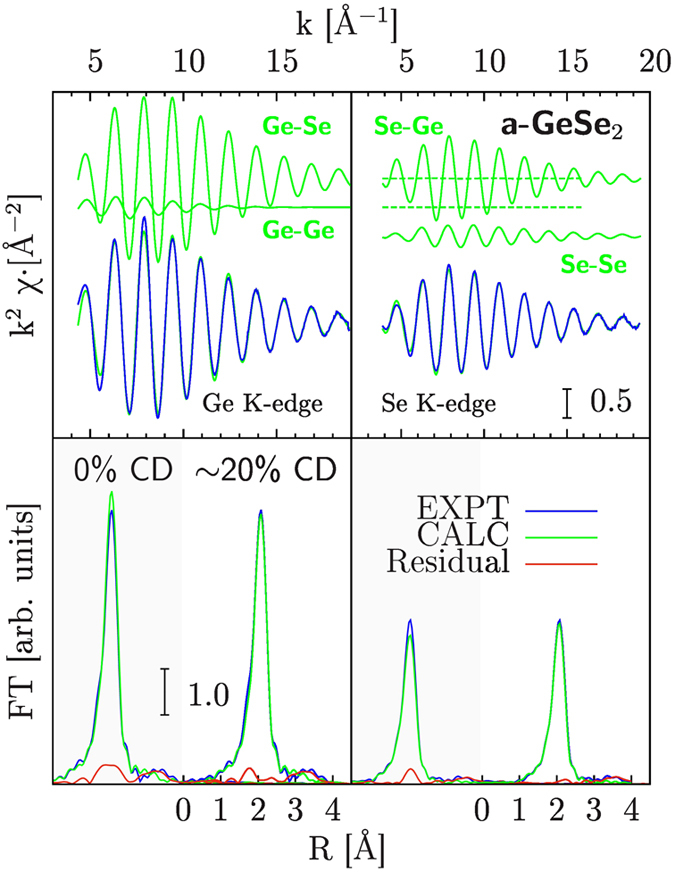
Figure 3.

Ge (Left) and Se (Right) K-edge XAS spectra of amorphous GeSe2 (a-GeSe2). Experimental (EXPT) and best-fit calculations (CALC) are compared in both panels. The dominant Ge-Se first-neighbor signal is accompanied by weaker short-range Ge-Ge and Se-Se signals, due to the existence of chemical disorder. Those first-neighbor signals explain nicely the experimental data, being the medium-range ordering signal above 3 Å almost negligible as shown by Fourier Transform (FT) spectra of experimental, best-fit calculated, and residual signals in the lower panels. The bottom frames show also the fit done without chemical disorder (CD) in order to make the reader appreciate the improvement of the residue.
