
Figure 4.
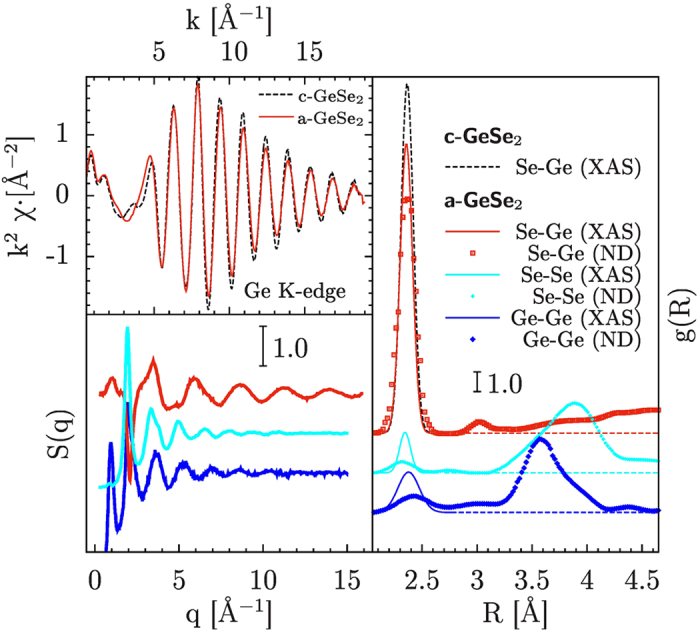
The XAS signals of c-GeSe2 (dots) and a-GeSe2 are compared in the upper-left panel, showing some differences (amplitude and near-edge) related to the different ordering of the two systems. The partial structure factors  of a-GeSe2 measured by neutron diffraction1 are shown in the lower-left panel. The Se-Ge, Ge-Ge, and Se-Se partial distribution functions in a-GeSe2 as measured by XAS and neutron-diffraction (ND) are shown and compared with the Ge-Se distribution in crystalline GeSe2 (c-GeSe2) in the right hand-side panel.