Figure 7.

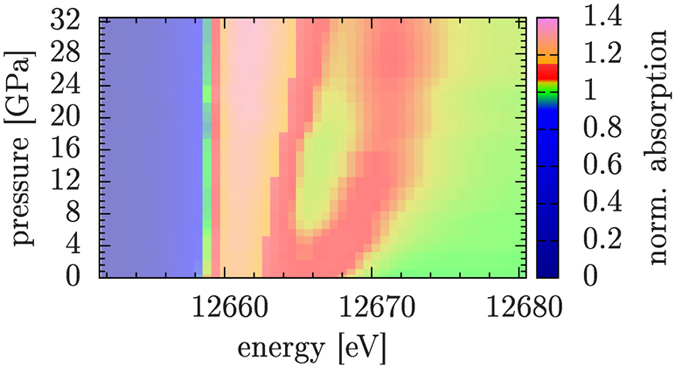
Variation of the Se K-edge XANES features as a function of pressure for a-GeSe2 (color scale reported in the right panel), associated with changes induced by compression in the local structure (see text).

Variation of the Se K-edge XANES features as a function of pressure for a-GeSe2 (color scale reported in the right panel), associated with changes induced by compression in the local structure (see text).