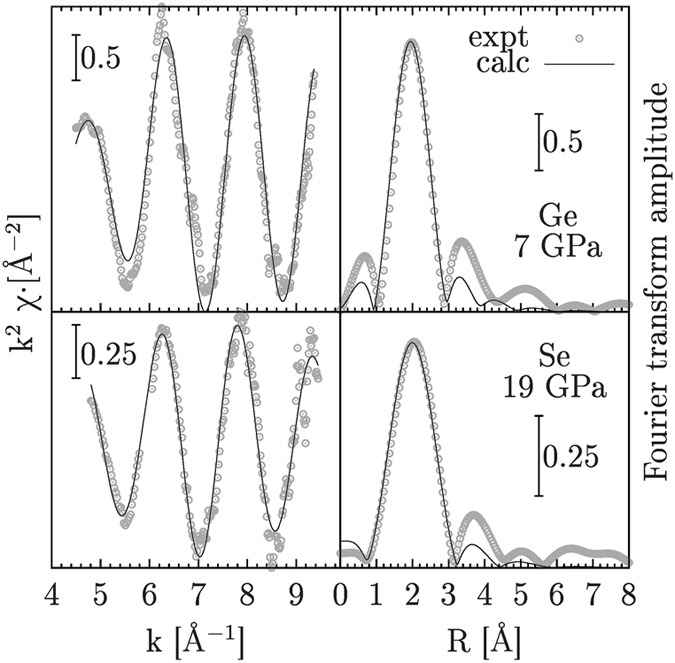
Figure 8.

Left panels: Ge (upper inset) and Se (lower inset) K-edge XAS experimental (circles) and best-fit calculated structural signals of a-GeSe2 at high pressure (7 and 19 GPa respectively). Right-side panels: Fourier transform spectra of the XAS structural signals reported in the left-side panels. An excellent agreement is obtained modeling the first-neighbor Ge-Se distribution as reported in the text.
