
Figure 7.
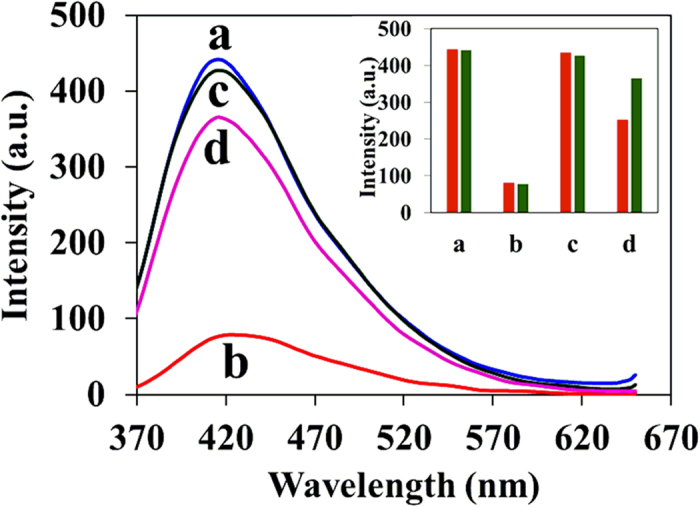
Fluorescence response of C-dots1 in the absence and presence of Fe3 + (2.5 × 10⁻⁴ M) and S2O32− (3.0 × 10⁻³ M); a: C-dots1, b: C-dots1/Fe3 + , c: C-dots1/S2O32−, d: C-dots1/Fe3 + /S2O32−. Inset: Bar diagram showing the fluorescence intensity changes for different combination of inputs, Red color: in the presence of low concentration of S2O32− (2 × 10⁻⁴ M), Green color: in the presence of high concentration of S2O32− (3.0 × 10⁻³ M).