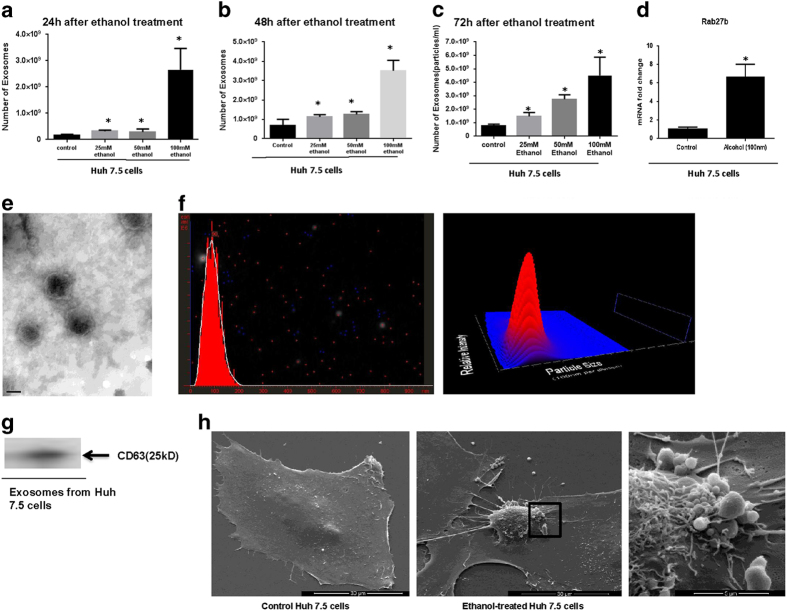
Figure 2. Kinetics of exosome production in the presence of ethanol and exosome characterization in Huh7.5 hepatoma cell line.
A) Different doses of ethanol were added to Huh 7.5 cells for 24 h. Total number of exosomes was measured 24 h after ethanol treatment with different dosage including 25 mM, 50 mM, and 100 mM by an NTA system. Data presented as particles/ml. B) Different doses of ethanol were added to Huh 7.5 cells for 48 h.Total number of exosomes was measured 48 h after ethanol treatment with different dosage including 25 mM, 50 mM, and 100 mM by an NTA system. C) Different doses of ethanol were added to Huh 7.5 cells for 72 h.Total number of exosomes measured 72 h after ethanol treatment with different dosage including 25 mM, 50 mM, and 100 mM by an NTA system. D) The expression level of RAB 27b mRNA was identified in the hepatocytes after alcohol treatment using a quantitative real-time PCR. 18S was used as internal control for qPCR analysis. E) Exosomes derived from Huh 7.5 cells were negatively stained with 2% uracyl acetate after removing the extra moisture and visualized using an electron microscopy. F) The mean diameter (nm) of the exosomes derived from Huh7.5 cells was identified by a Nanoparticle Tracking Analysis (NTA). G) The presence of exosomal marker CD63 in exosomes derived from Huh 7.5 cells were identified by western blotting as shown in the single cropped blot. H) SEM of Huh 7.5 cells treated with alcohol compared to control Huh 7.5 cells (2 kX). The area in the box is magnified in the right picture (10 kX). (*indicates p < 0.05 versus control conditions) The quantitative results represent three independent experiments.

