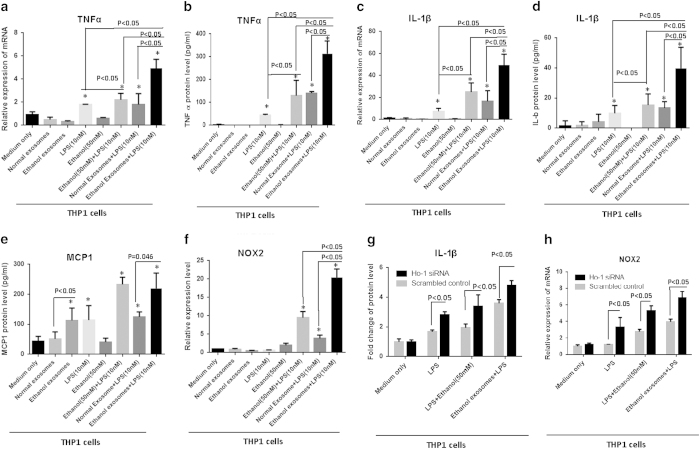
Figure 6. Immunomodulatory effects of ethanol-treated hepatocytes on human THP1 monocytes.
Huh7.5 cells were treated with 100 mM ethanol for 48 h and exosomes were isolated with combination of filtration and ExoQuick-TC. Isolated exosomes from ethanol treated cells and non-ethanol treated cells (normal exosomes) were co-cultured with THP1 human monocytes for 8 h. After 8 h, exosomes were washed off and media replaced. 16 h later, RNA and cell supernatant were harvested and analyzed for target measurements. In the groups containing LPS, 10 nM was added to the THP1 cells 6 h before harvesting. A) The levels of TNFα mRNA expression were measured using quantitative real-time PCR (qPCR). 18S was used to normalize the Ct values between the samples. B) The levels of TNFα protein in the supernatant were measured by ELISA. C) The levels of IL-1β mRNA expression in THP1 cells were measured using qPCR. 18S was used to normalize the Ct values between the samples. D) The levels of IL-1β in the supernatant were measured by ELISA. E) The levels of MCP1 in the supernatant were measured by ELISA. F) The level of Nox2 mRNA expression in the THP1 cells were measured with qPCR. 18S was used to normalize the Ct values between the samples. G) HO-1 siRNA and scrambled siRNA control were introduced to THP-1 cells by electroporation. 2 × 10⁵ cells were re-suspended in 150 μl complete RPMI media and 150 μl Gene Pulser®Electroporation buffer for 5 min on ice before being electroporated. Electroporation was done at 300 kV and 1500 μF. Following electroporation, cells were kept on ice for 10 min then cultured in media for 48 hours. 10 nM LPS was added to the THP1 cells in the pertinent groups 6 h before harvesting. Ethanol exosome was added 24 h before harvesting. After 48 h supernatants were collected and levels of IL-1β were quantified by an ELISA. H) After knockdown of HO-1 by introducing siRNA to the THP1 cells as described in the previous section, RNA was extracted and expression levels of Nox2 mRNA were measured using qPCR. 18S was used to normalize the Ct values between the samples. The results represent three independent experiments. (*indicates p < 0.05 versus control condition)

