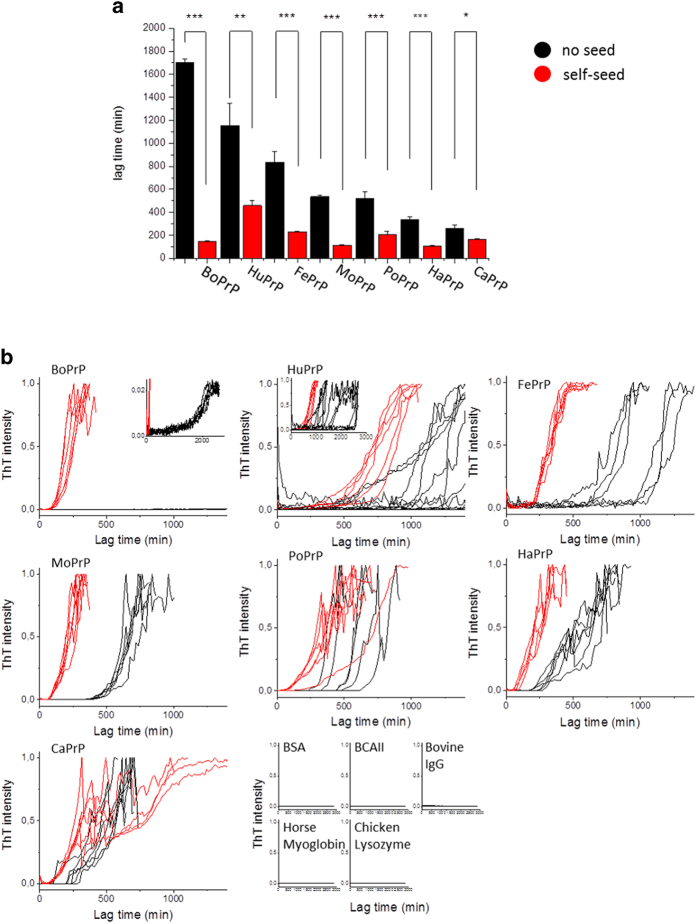
Figure 4. Fibrillation kinetics monitored by ThT fluorescence.
a) Summary of lag times for unseeded (black) and seeded (red) conversion for PrPs (significance as calculated by paired t-test. Significance denoted with stars where * indicates p < 0.05, ** indicates p < 0.005 and *** indicates p < 0.001) b) Normalized kinetic traces for unseeded (black) and seeded (with 1% preformed fibrils) (red) fibril conversion of all PrPs. The intensities have been normalized to the maximum value of each trace except for BoPrP which was normalized to the average maximum value for all the other PrPs. One out of 21 BoPrP samples converted similar to the other PrPs and has been retracted from the plots. Unseeded HuPrP samples from several experiments have been pooled. c) Kinetic traces for the globular control proteins as noted in the figure, intensities normalized to the average maximum values of the PrPs (excluding BoPrP).

