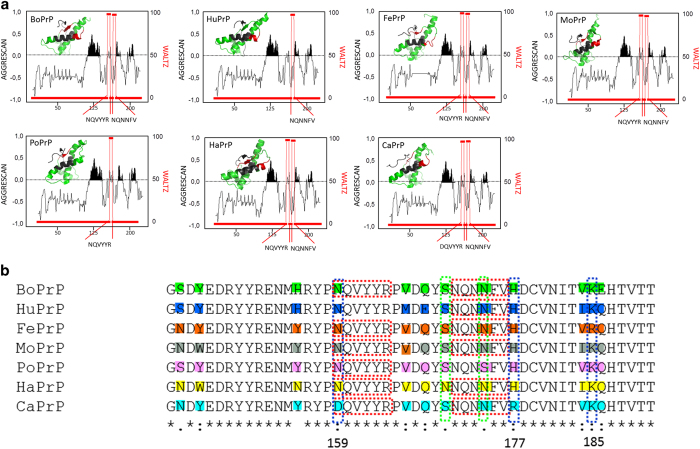
Figure 6. Comparison of mammalian PrP sequences.
a) Prediction of aggregation prone sequences (AGGRESCAN46) and amyloidogenicity (WALTZ47) for BoPrP, HuPrP, FePrP, MoPrP, PoPrP, HaPrP, and CaPrP. Continuous stretches with an aggrescan score >1 are regarded as aggregation prone and these peaks are highlighted in black. The PDB structures for each sequence with the predicted amyloidogenic stretches marked in red and aggregation prone sequences in black (PDB entries: BoPrP 1DWY, HuPrP 1QM2, FePrP 1XYJ, MoPrP 1XYX, PoPrP 1XYQ, HaPrP 1B10, and CaPrP 1 XYK14,15,16,17,18). (b) Primary sequence alignments of the polymorphic region implicated as important for disease susceptibility. Stars indicate identical residues colon denotes conserved residues and points mark non-conserved mutations. Mismatched residues are marked in color. The red boxes highlight amyloidogenic stretches according to the WALTZ prediction tool, the blue boxes highlight amino acids modifying disease susceptibility according to57 and the green boxes indicate the positions 170 and 174 involved in “rigid loop” formation55.

