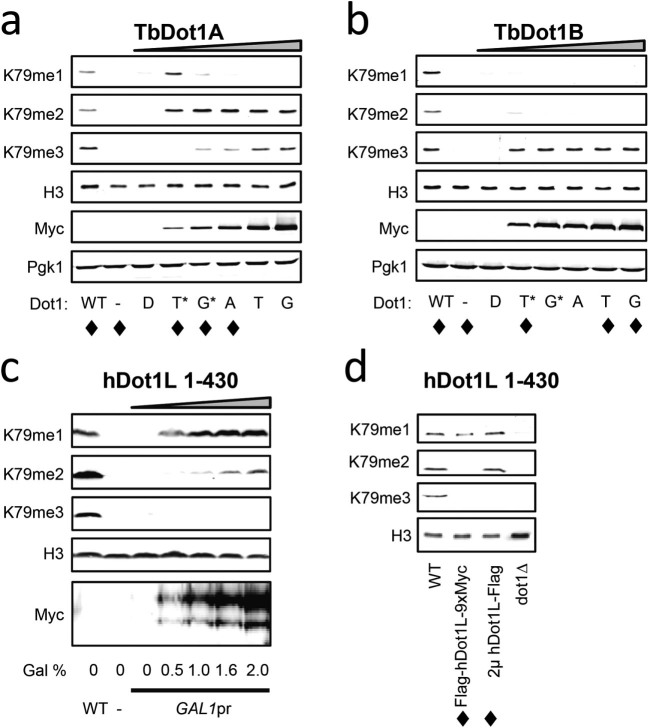
Figure 2. Quantitative assessment of H3K79/K76 methylation by TbDot1A, TbDot1B and hDot1L.
Western-blot analysis of H3K79 methylation states generated by TbDot1A (A), TbDot1B (B) and hDot1L (C) upon expression from the yDOT1 locus in yeast. H3K79 methylation states were determined using specific H3K79 methylation antibodies and the Dot1 enzymes were detected using their Myc and/or Flag tags. H3 and Pgk1 were used as loading controls. H3K79 methylation patterns that were confirmed by mass spectrometry are indicated with ♦. A-B) TbDot1A (A) and TbDot1B (B) enzymes were expressed from the same promoter series as described in Fig. 1B. C) hDot1L was expressed in yeast from the GAL1 promoter at the endogenous yDOT1 locus (Flag-hDot1L-9xMyc) upon induction by 2% galactose as the sole carbon source in rich medium. D) hDot1L was expressed in yeast from the GAL1 promoter at the endogenous yDOT1 locus (Flag-hDot1L-9xMyc) or at a multi-copy plasmid (2µ-hDot1L-Flag) upon induction by 2% galactose as the sole carbon source in the minimal medium. Human Dot1L protein expression levels are shown in Supplemental Fig. S4.

