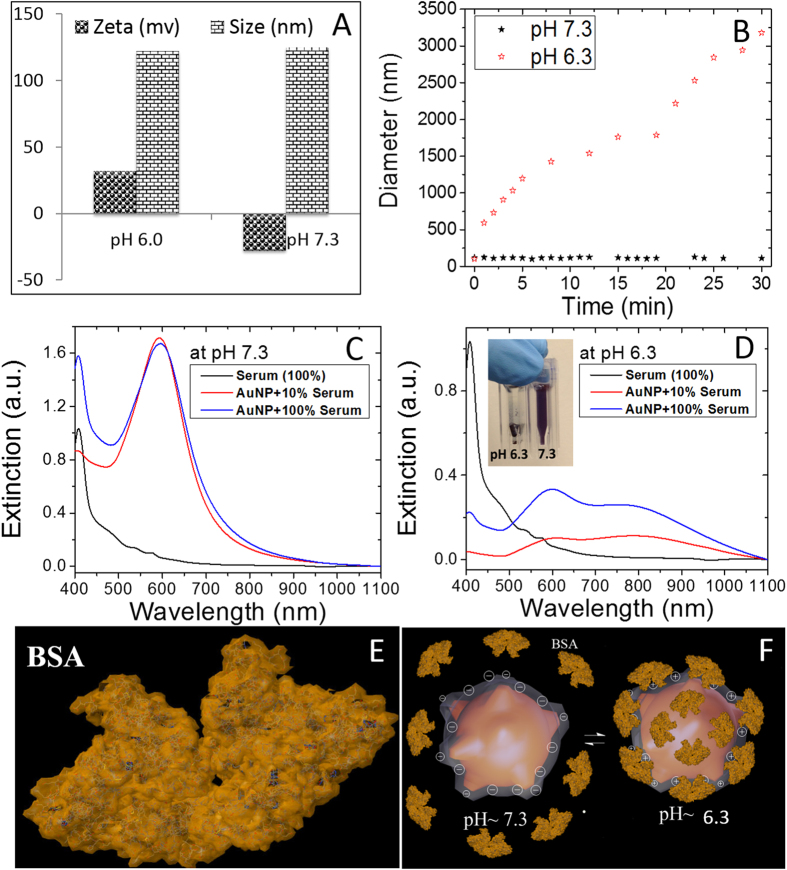
Figure 3. pH dependent serum stability of GRBs.
(A) Zeta potential and hydrodynamic size of GRBs at both physiological (~7.3) and tumorigenic (6.3) pH (B). Time dependent formation of protein corona on GRBs and subsequent aggregation of GRBs at pH 7.3 and 6.3. Vis-NIR extinction spectra of GRBs after incubating with 10% and 100% serum at (C) pH 7.3 and (D) pH 6.3. Inset of (D) shows that at pH 6.3, GRBs aggregate and sediment at the bottom of the cuvette. (E) X-ray crystal structure of BSA, an abundant protein in plasma (F) Schematic representation of protein corona formation at both physiological (~7.3) and tumorigenic (6.3) pH.

