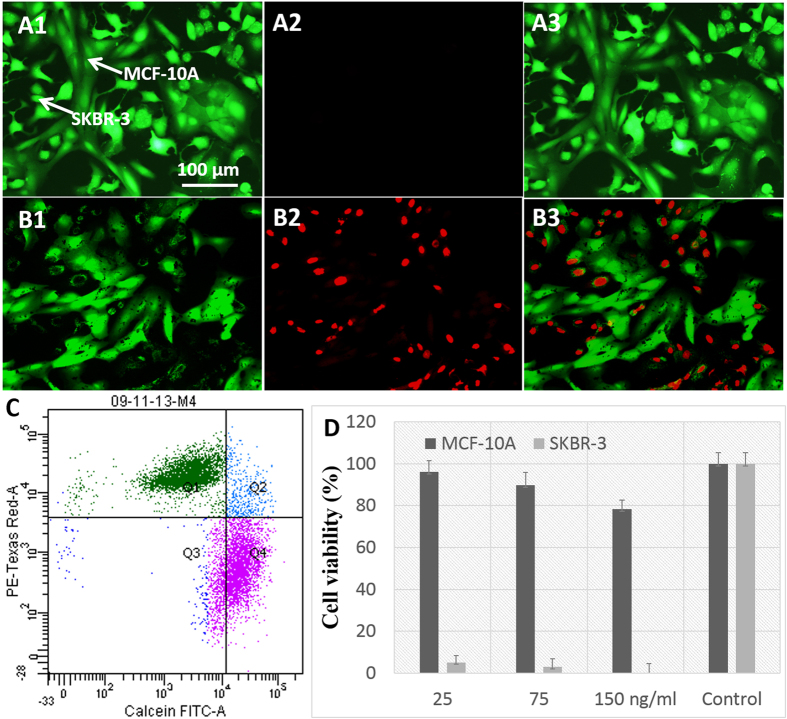
Figure 7. Selective photothermal therapy and quantification.
Fluorescence images of co-cultured cells with live/dead staining after laser exposure in the absence (A) and presence (B) of GRBs. (C) Flow cytometry of GRBs targeted co-cultured cells to quantify the number of live (pink) and dead (green) cells after photothermal treatment. (D) Viability of SKBR-3 and MCF-10A cells after photothermal therapy at different concentration of GRBs. After photothermal therapy, most of the SKBR-3 cells are dead even at very low concentration whereas 98% of MCF-10A cells are viable.

