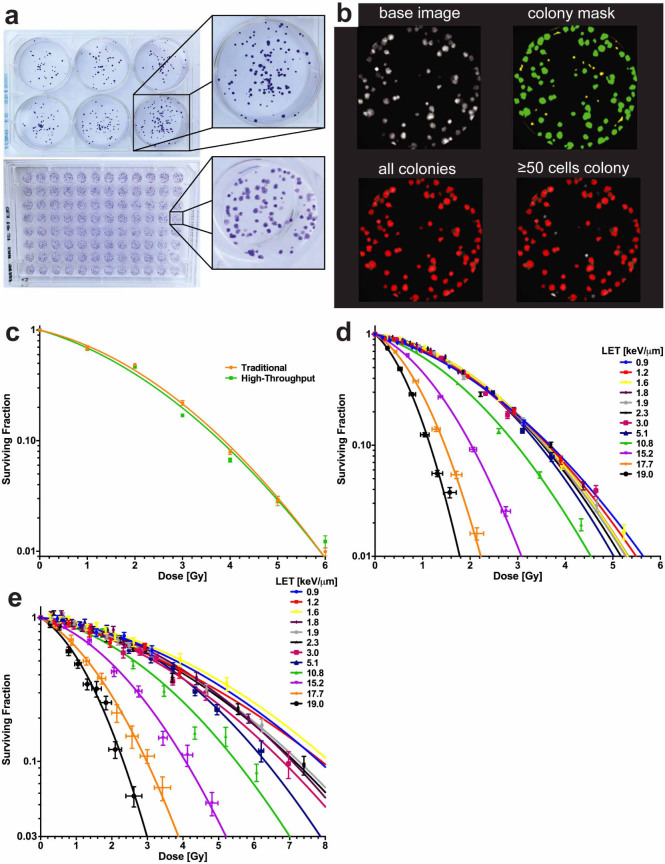
Figure 3. High-throughput clonogenic assays of H460 and H1437 NSCLC cells.
(a) As a benchmark for our 96-well system, we compared cultures in that format, processed and counted with the IN Cell Analyzer 6000, with those in 6-well plates, counted manually. Characteristic images of each plate type are shown. (b) Representative images of a single well depicting high-content image processing. (c) Cell survival curves for individual plates of cells grown in 6-well or 96-well systems, exposed to 137Cs gamma irradiation, and scored by manual or automated processing. Curves were found to be not statistically different between the techniques (P = 0.315, extra sum-of-squares F test). Error bars represent standard error of the mean (s.e.m.). (d) Clonogenic survival plotted as a function of dose and LET for proton irradiation experiments with H460 cells. Error bars for dose were calculated by sensitivity analysis and SF with s.e.m. (e) Clonogenic survival as a function of dose and LET for proton experiments performed with H1437 cells. P < 0.0001 for comparisons of 0.9 keV/µm to ≥10.8 keV/µm, extra sum-of-squares F test.

