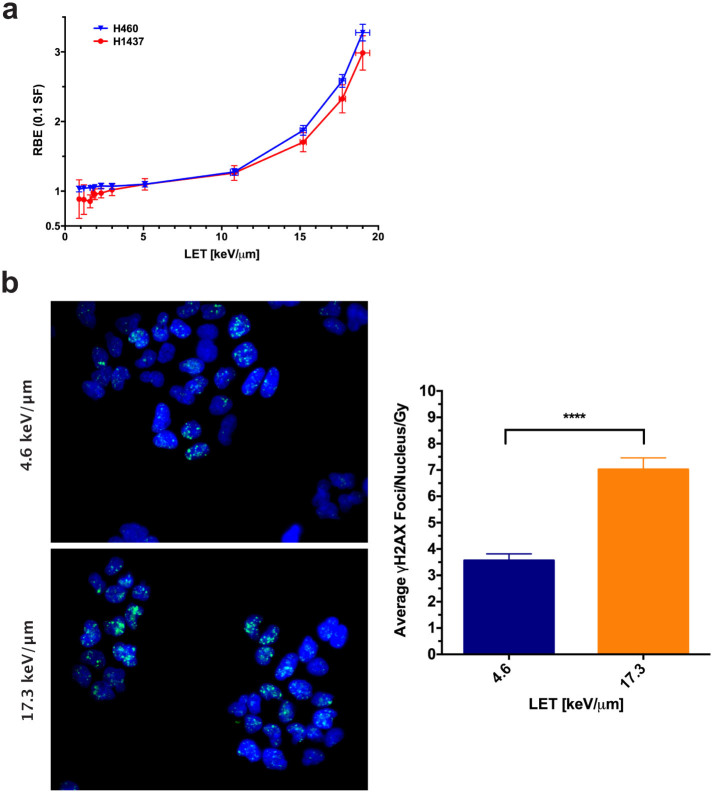
Figure 4. Preliminary analysis of biological assays.
(a) RBE vs LET at 10% SF. A nonlinear trend between biological effect and LET was observed for both cell lines. RBE error was calculated by propagating the standard error of the α and β fits from Fig. 3 (Supplementary Table 1). (b) H460 cells were plated in glass-bottom 96-well plates, irradiated, and processed 2 hours later for γH2AX foci staining. Representative images are depicted. Comparing wells exposed to LETs and doses of 4.6 keV/μm, 2.9 Gy and 17.3 keV/μm, 1.7 Gy, the average nuclear foci per Gy was significantly increased in the high-LET samples (P < 0.0001, Mann-Whitney unpaired t test). Error bars represent the 95% confidence level.

