Figure 3.
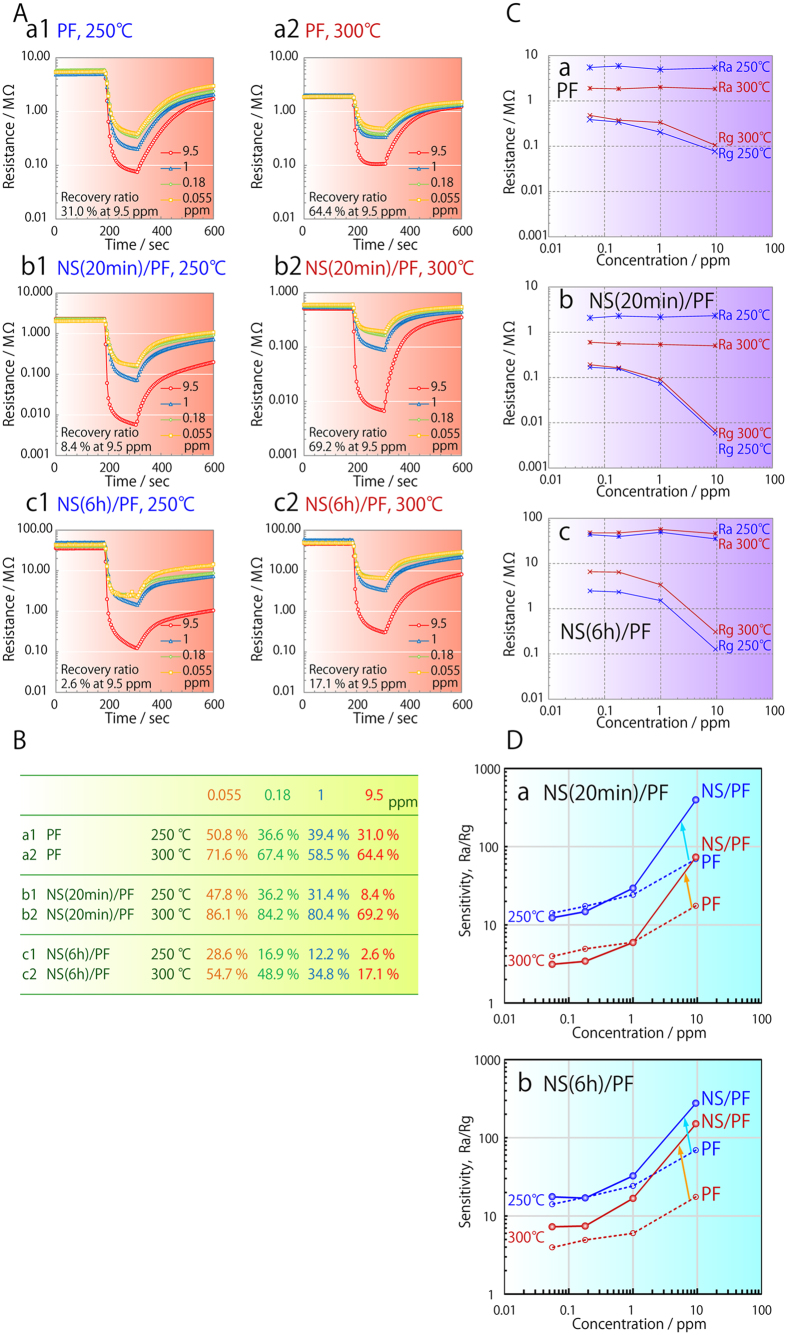
A: Response curves of (a1,a2) a particulate film (PF), (b1,b2) a particulate film with nanosheets produced by 20 min immersion in SnF2 solution (NS(20 min)/PF) and (c1,c2) a particulate film with nanosheets produced by 6 h immersion (NS(6 h)/PF). Concentration of 1-nonanal gas was 0.055, 0.18, 1 or 9.5 ppm, and this was evaluated at (a1,b1,c1) 250 °C or (a2,b2,c2) 300 °C. B: Recovery ratio of the different particulate films. C: Change in resistance as a function of 1-nonanal gas concentration. Ra and Rg of (a) PF, (b) NS(20 min)/PF and (c) NS(6 h)/PF at (blue lines) 250 °C or (red lines) 300 °C. D: Change in sensitivity with 1-nonanal gas concentration for (a) NS(20 min)/PF (solid circles and lines) and PF (open circles and dotted lines), and (b) NS(6 h)/PF (solid circles and lines) and PF (open circles and dotted lines) at (blue lines) 250 °C and (red lines) 300 °C.

