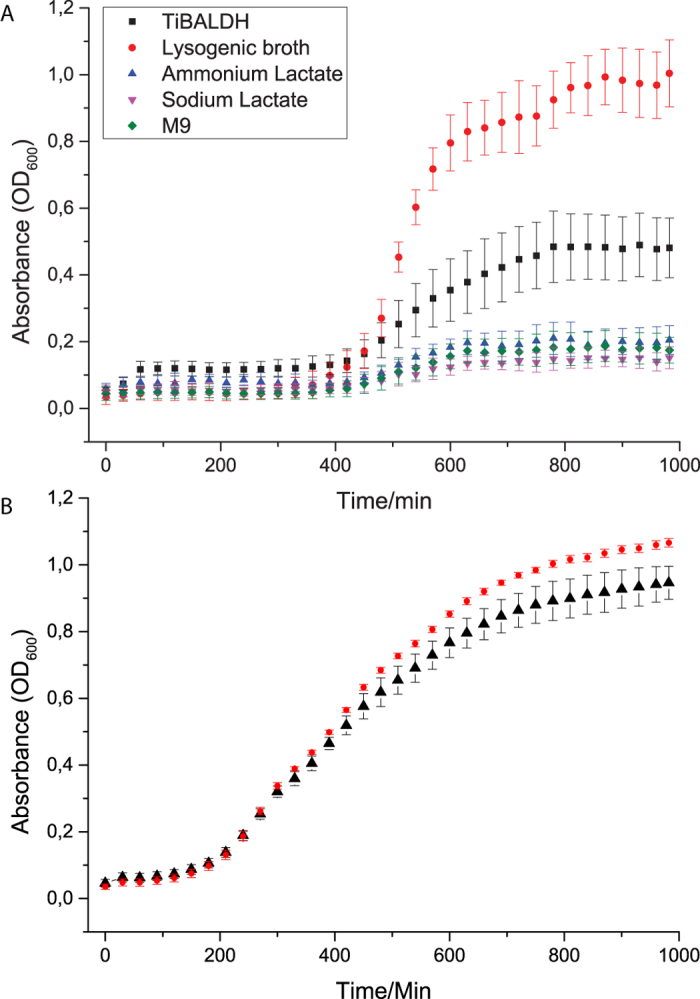
Figure 2.

Growth of bacteria as measured by absorbance (OD600) over time in minutes. Values represent mean values of eight biological replicates ± SD. Panel A. TiBALDH derived nanoparticles. Bacteria grown in M9 medium together with 50 μg TNs is noted with a square ■. Positive control with sodium lactate is noted with an upside down triangle ▲, ammonium lactate is noted with a triangle ▲, and bacteria grown in LB-medium noted by a full circle • and negative control with the bacterium grown in M9 is noted by a diamond ♦. Panel B. Captigel derived nanoparticles.
